Supersize Apache Superset with Lucidworks Fusion — Part 2
If you haven’t read the first post in this series, jump to Supersize Apache Superset With Lucidworks Fusion — Part 1.
There are many challenges that users encounter when they try to build software on their machines. While I still find it helpful to work on some apps locally, it saves time to use software on a platform similar to the production platform.
Using Lucidworks Labs you can launch an app that already includes data for restaurants in Sacramento. All you need to do is run the index workflow (add a datasource and crawl it) and the data will be transformed and loaded into a Fusion collection for use with Superset.
You will need a GitHub link to start a stream.
From that link, click “Create Instance” and select “Superset”.
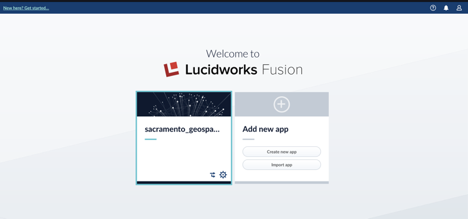
Once Fusion is up and running, visit the URL listed in the dashboard. There, you can log in with the username and password provided there as well. Once in, you will see an existing app that’s preloaded and an app with the option to create/import a new app. Click the box labeled Sacramento Geospatial on the left to enter the app.
To connect to Superset, visit the IP of your fusion application and the port 8088. For example:
http://35.203.178.8:8088/ # note this is not a real domain. It is an example.
The username is admin and the password is superset.
Next, connect Superset to your Fusion app. Once you authenticate, click “Sources” in the top nav, and click “Databases” (Sources > Databases). Add the name GeospatialFusion. Then add a connection string.
Here is the structure of the connection string:
hive://admin:<password>@<Internal IP>:8768/default;transportMode=binary?auth=CUSTOM
The Internal IP can be found in your instance dashboard. To locate your Internal IP, click the “Console Log” tab to change your dashboard view. Once you do that, search the page for ens4 | True. The IP that follows is the one you need to use for the value of Internal IP. Then click “Save”.
To add a table click “Sources” in the top nav and click “Tables” (Sources > Tables). Below, you will find the settings for the Tables.
Databases: GeospatialFusion
Schema: default
Tables: sacramento_geospatial
Click “Save”.
Creating a Basic Pie Chart with the Sample Data
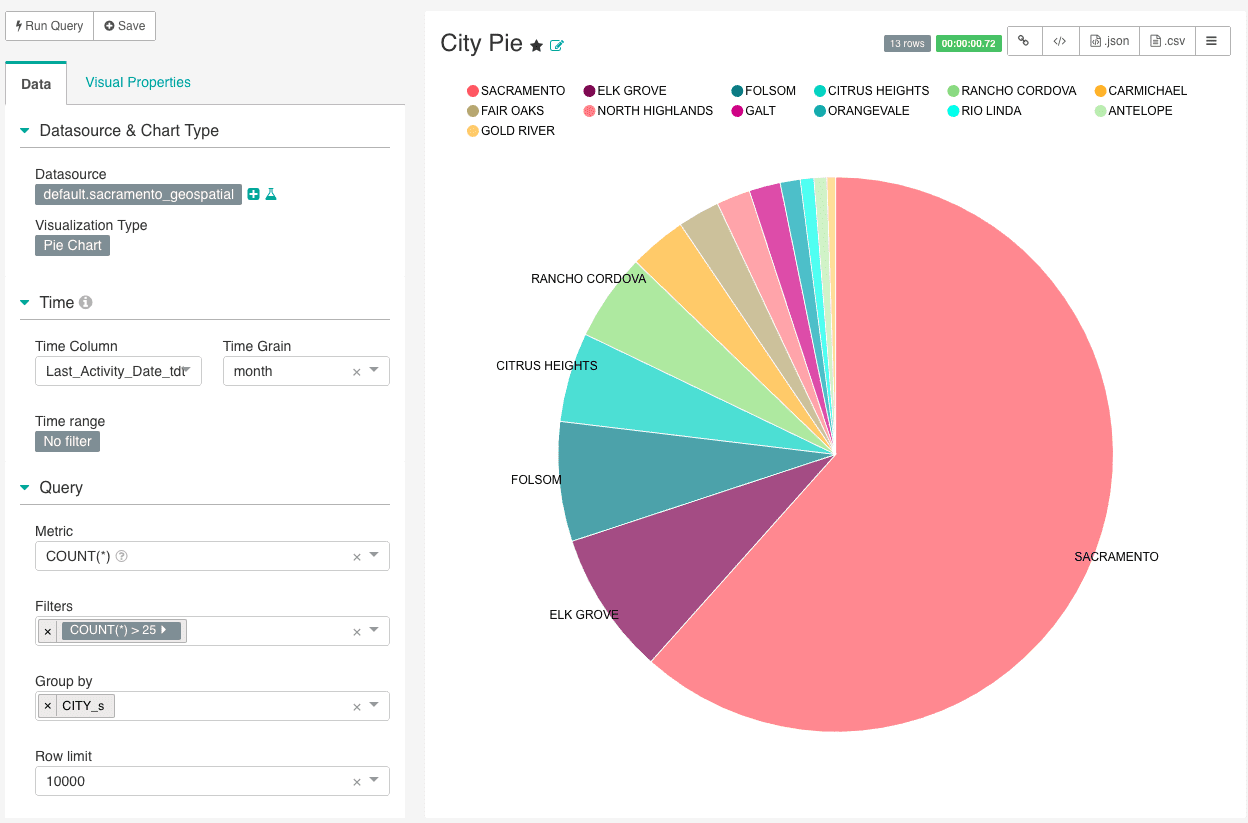
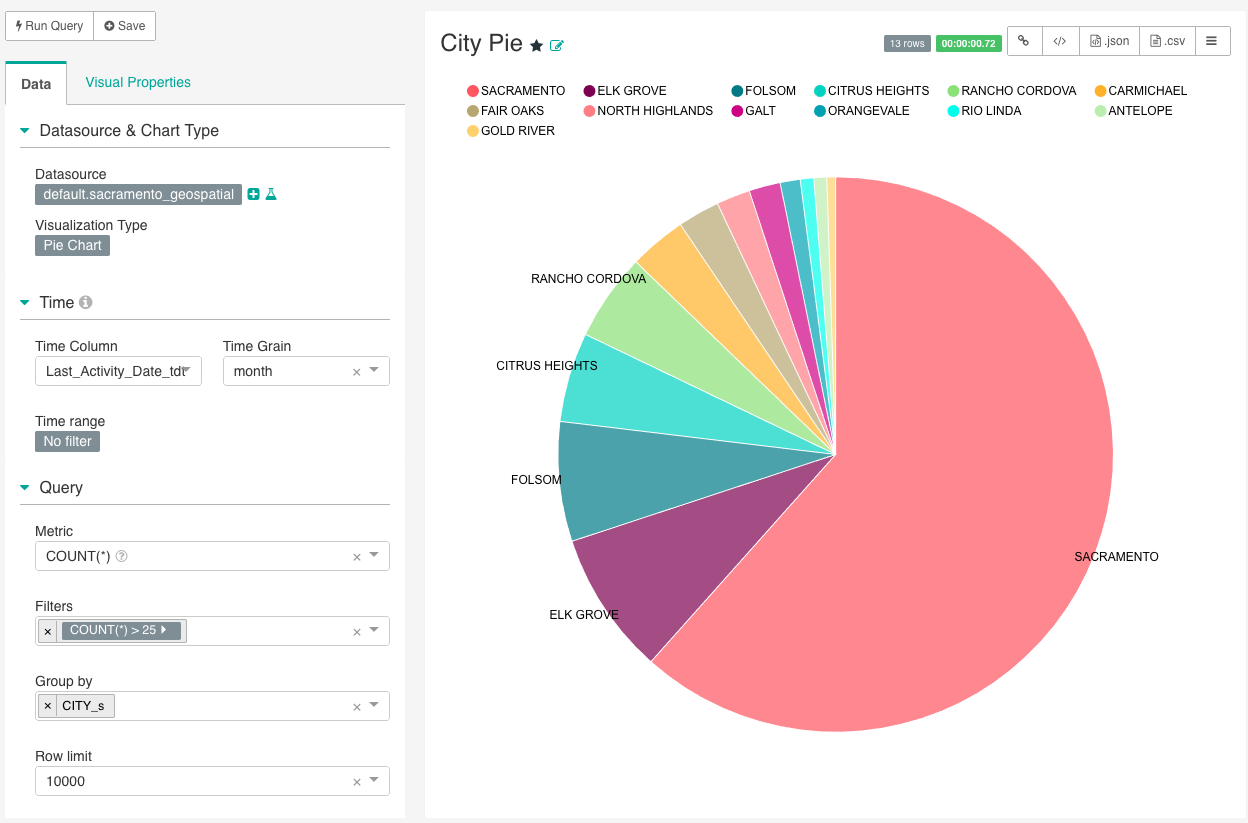
Let’s quickly create a pie chart that graphs the share of restaurants by city in the Sacramento Metro region. To jump in, click “Charts” at the top nav. In the upper right corner of the List Charts view, click the green plus button.
In the view of the create a new chart, select default.sacramento_geospatial as the data source and the Pie Chart as the visualization type. Then click “Create new chart.” In this view, change the Time range in the left to No Filter. For Metrics, select COUNT(*). In the Filters section, modify the SQL statement to be COUNT(*) > 25, so we eliminate cities that don’t have many eateries. For GROUP BY, add the CITY_s field. Change the Row limit value to 10,000. And, voila:
As you continue your journey to improve access to information for your customers with an AI-powered search engine, visualization will be an asset at every stage of your search development lifecycle. When you are thinking about what words to boost, or collaborating with your business partners, having visualizations available to support your analysis can be very helpful.
After you get everything set up, feel free to load your own data into Lucidworks Fusion to check out visualizations in your lab instance.
Stay tuned for PART 3 when we will be exploring geospatial visualizations for our search corpus.
Read Supersize Apache Superset With Lucidworks Fusion — Part 1
LEARN MORE
Contact us today to learn how Lucidworks can help your team create powerful search and discovery applications for your customers and employees.