Java Garbage Collection Boot Camp (Draft)
UPDATE: I have finished version 1.0: http://www.lucidimagination.com/blog/2011/03/27/garbage-collection-bootcamp-1-0/
I’m working on a Garbage Collection article – I figured I’d share an early rough draft:
It’s not often the case, but sometimes when working with a large and busy Solr/Lucene installation, Garbage Collection becomes a bottleneck. This guide is meant to help you relieve that bottleneck should it arise.
Garbage collection in Java is the processes of freeing the memory used by objects that are no longer in use. In C or C++ you would be responsible for freeing this memory yourself, but in Java, this task is left up to the garbage collector, allowing the programmer to concentrate on other tasks and leave memory management up to the JVM.
The most basic garbage collection algorithm works by starting at the root objects (ie objects on the thread stack, static objects, etc) that are live (live meaning currently in use) – and then iterating down over every reachable object. Any object that cannot be reached in this manner is garbage and can be collected. The application is paused while this process goes on. This is referred to as mark and sweep – first you mark the objects that are live, then you sweep those that are not. The time needed to do this is obviously proportional to the number of live objects (which can be quite a large number in modern Java applications), and so more efficient collection schemes have been devised.
One such scheme comes from the natural fact that you can divide up objects based on how long they live. Most applications create a lot of very short lived objects, and fewer objects that around for a long time (I’ve seen estimates that for the average application, 85-98% of allocated objects are short lived). You can take advantage of this fact when doing collections. The Java heap is generally divided up into a few spaces (its usually the same across implementations, but there is the odd exception or two). The major spaces are the young generation, the tenured generation (also called the old generation), and the permanent generation. The young generation is then further sub divided into the eden space and two survivor spaces. The permanent generation is generally for objects that are around for the life of the application (interned Strings, class objects, etc) and doesn’t usually play much of a role in garbage collection (though the permanent generation can actually be collected if needed using -XX:+CMSPermGenSweepingEnabled).
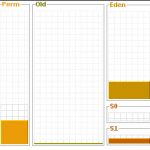
When objects are first created, they are allocated within the eden space. When the eden space becomes full, the still live objects within it are copied into one of the survivor spaces (or if they don’t fit, into the tenured space). One survivor space is always left empty, and on each young generation collection (a minor collection), the live objects from the eden space and the non empty survivor space are copied into the empty survivor space. This leaves a newly emptied survivor space for the next round, as any still live objects in the formerly full survivor space will be copied into the tenured space.
As you can see, rather then running over every object for every collection now, you can collect the young generations more often, and the tenured generation (long lived objects), much less often. You can also optimize your collection for the characteristics of the space – ie usually, almost all of the objects in the young space will be garbage. In general, an object will have to survive a couple minor collections to make it to the tenured space (first making it into a survivor space and then the tenured space).
Tuning for garbage collection means adjusting the sizes of these various spaces, as well as the algorithms used to collect them. You can do this with various JVM command line options.
The amount of RAM available for the various spaces is dependent upon the size of the heap that the JVM has allocated. Defaults are chosen based on the hardware detected, but you can usually do better by specifying a good Xms, Xmx yourself. On a server machine, it can be a good idea to pin those two settings together so that the JVM does not waste any time resizing itself.
Sizing the individual spaces:
You usually want to grant plenty of memory to the young generation – especially when you have multiple processors – as allocation can be parallelized and each thread will get its own private piece of the eden space to work with. You generally want the young generation to have less than half the space of the tenured generation though – especially when using the Serialized collector. About 33% is usually a good number to start from. The best size will vary from application to application depending on its distribution of young vs long lived objects. You don’t want the young space to be so small that many short lived objects are getting piled into the tenured space. You also usually don’t want it to be so large that the tenured space doesn’t have enough space available to it and/or young generation collections start taking too long to complete.
Other than sizing the total heap, sizing the new generation (another name for the young generation) can be the most important piece to good performance.
-XX:NewSize – Size of the young generation at JVM startup – this is calculated automatically if you specify -XX:NewRatio
-XX:MaxNewSize – The largest size the young generation can grow to (unlimited if not specified)
-Xmn – sets the new generation to a fixed size – this is not usually recommended unless you are fixing the other memory sizes as well.
-XX:NewRatio=n (dynamic size) sets the new generation size as a ratio to the tenured generation size.
You can also control the sizing of the survivor spaces – in practice this is not usually very helpful though.
-XX:SurvivorRatio=6
The best sizing is usually chosen by playing with the parameters and then testing the performance of your application. There are a few helpful tools that give you insight into the garbage collection process.
You can use the following command line options to generate information about the garbage collection process:
-verbose:gc – print info about heap and gc on each collection.
-XX:+PrintGCDetails – print addictional gc info
-XX:+PrintGCTimeStamps – add timestamps
There is also a very cool tool called VisualGC that you can use to visually watch how objects move between spaces. This is available as a standalone application, or as a plugin for both Netbeans and VisualVM.
The Collectors:
There are three main Collectors that you should concern yourself with (much of this applies to Java 1.4, but in general, I am targeting Java 1.5 and up). These collectors are: the Serialized Collector, the Throughput Collector, and the Concurrent Low Pause Collector. There is also another young generation collector that can be paired with the throughput collector called the the Parallel Young Generation Collector.
There is also an older incremental collector (unsupported and also called the train collector), and an incremental collection mode for the concurrent low pause collector (that I touch on and is generally used when only one or two CPU’s are available), but I’ll leave those for you to explore on your own if you are interested.
The Serialized Collector
-XX:+UseSerialGC
With the serialized collector, a major collection is done when the tenured space is full. This is known as a “stop the world” collection, because all application threads will be paused while the collection occurs.
This collector is best used with small applications, applications run on a single CPU machine, or applications where pause times don’t matter. This collector is relatively efficient because it does not need to communicate between threads, but you have to be willing to accept its “stop the world” pauses. Minor collections will “stop the world” as well, but are generally fairly efficient and fast.
The Throughput Collector (also known as the Parallel Collector)
-XX:+UseParallelGC
The throughput collector uses a parallel version of the young generation collector, while the tenured generation will still use the serial collector. So while a single thread will still perform collections on the tenured space, multiple threads will work together collecting the young space.
A feature called parallel compaction was added in Java 1.5 update 6 – this feature allows the throughput collector to also perform major collections in parallel. You can enable this with -XX:+UseParallelOldGC. Using this should help a lot with scalability, as you sidestep the single collection thread bottleneck.
The throughput collector should be the default collector chosen on server class machines (in Java 1.5 and up). If memory serves, a 32-bit Windows machine is never detected as a server class machines – other OS’s are considered server class based on how much RAM and CPU’s they have access to. You can always override these defaults though.
Throughput is usually most useful when your application has a large number of threads creating new objects, and you have more than one processor available (though more than two is best). Typically, when you have multiple threads allocating objects, you also want to increase the size of the young generation. The number of garbage collector threads will generally be equal to the number of processors you have, but you can control that number with -XX:ParallelGCThreads=n. Sometimes you will want to lower the number of threads because each will reserve a part of the tenured generation for promotions – this can cause a fragmentation effect and effectively lower the size of the tenured generation (this is generally only an issue if your application has access to many processors or cores).
The throughput collector also supports something called Ergonomics. As part of this support, you can specify various desired behaviors for your application, and the JVM will attempt to tune various settings to meet your goals.
-XX:MaxGCPauseMillis=n hint to the throughput collector that a max pause time of n milliseconds is desired. By default there is no hint. The collector will adjust the heap size and other collection parameters in an attempt to meet the hint – keep in mind that throughput may be sacrificed in the attempt to meet this goal. There is also no guarantee that the goal will be met.
You can also specify a target goal for how much time is spent in garbage collection in comparison to running your application using -XX:GCTimeRatio. By default this is set to 1% (keep in mind that these defaults tend to change from release to release).
With the serialzed garbage collector a generation is collected when it is full (i.e., when no further allocations can be done from that generation). This is also true of the throughput collector.
The Concurrent Low Pause Collector
-XX:+UseConcMarkSweepGC
Use the concurrent low pause collector when you can afford to share the processor resources with the garbage collector while the application is running. This is usually good for an application with a lot of long lived data – meaning you need a large tenured generation space. Obviously, having multiple processors is also helpful. This collector still pauses the application threads twice in a collection – once briefly at the start (when it marks objects directly accessible from root objects), and a slightly longer pause towards the middle (when it sweeps to find what it missed due to parallel marking) – the rest of the collection is done concurrently using one of the available processors (or one thread). If this collector cannot complete collecting the tenured space before it is full, all threads will be paused and a full collection performed – this likely means you need to adjust the concurrent collection parameters.
This collector is used for the tenured generation, and does the collection concurrently with the execution of the application. This collector can also be paired with a parallel version of the young generation collector (-XX:+UseParNewGC).
Note that -XX:+UseParallelGC (the throughput collector) should not be used with -XX:+UseConcMarkSweepGC, and the JVM will fail on startup if you try this with most modern JVMs.
The concurrent low pause collector will keep statistics so that it can best guess when to start collecting (so that it finishes before the tenured space is full) – also though, it will start collecting when the tenured space hits a percentage of what’s available – You can manually set this with -XX:CMSInitiatingOccupancyFraction=n. The default for this setting varies across JVMs. I’ve read that the default for 1.5 was 68%, while the default for 1.6 is 92%. You can lower this if needed to ensure that the collection is kicked off sooner, and then you will be more likely to finish the collection before the tenured space is full.
The concurrent low pause collector can also be used in an incremental mode that I will not go into here. This mode causes the low pause collector to occasional yield the processor used for parallel collection back to the application, and thereby lessen its impact on application performance.
The Parallel Young Generation Collector
-XX:+UseParNewGC
This collector is much like the throughput collector in that it collects the young generation in parallel. Most of what applies to the throughput collector also applies to this collector, however a different implementation is used that allows this collector to work in conjunction with the concurrent low pause collector, unlike the throughput collector.
The flip side of that coin is that while the throughput garbage collector (-XX:+UseParallelGC) can be used with adaptive sizing (-XX:+UseAdaptiveSizePolicy), the parallel young generation collector (-XX:+UseParNewGC) cannot.
-XX:+UseAdaptiveSizePolicy records statistics about GC times, allocation rates, and free space, and then sizes the young and tenured generations to best fit those statistics. This is for use with the throughput collector and is on by default.