Mining Events for Recommendations
Summary: The “EventMiner” feature in Lucidworks Fusion can be used to mine event logs to power recommendations. We describe how the system uses graph navigation to generate diverse and high-quality recommendations.
User Events
The log files that most web services generate are a rich source of data for learning about user behavior and modifying system behavior based on this. For example, most search engines will automatically log details on user queries and the resulting clicked documents (URLs).
We can define a (user, query, click, time) record which records a unique “event” that occurred at a specific time in the system. Other examples of event data include e-commerce transactions (e.g. “add to cart”, “purchase”), call data records, financial transactions etc.
By analyzing a large volume of these events we can “surface” implicit structures in the data (e.g. relationships between users, queries and documents), and use this information to make recommendations, improve search result quality and power analytics for business owners.
In this article we describe the steps we take to support this functionality.
1. Grouping Events into Sessions
Event logs can be considered as a form of “time series” data, where the logged events are in temporal order. We can then make use of the observation that events close together in time will be more closely related than events further apart. To do this we need to group the event data into sessions.
A session is a time window for all events generated by a given source (like a unique user ID). If two or more queries (e.g. “climate change” and “sea level rise”) frequently occur together in a search session then we may decide that those two queries are related. The same would apply for documents that are frequently clicked on together.
A “session reconstruction” operation identifies users’ sessions by processing raw event logs and grouping them based on user IDs, using the time-intervals between each and every event. If two events triggered by the same user occur too far apart in time, they will be treated as coming from two different sessions.
For this to be possible we need some kind of unique ID in the raw event data that allows us to tell that two or more events are related because they were initiated by the same user within a given time period. However, from a privacy point of view, we do not need an ID which identifies an actual real person with all their associated personal information. All we need is an (opaque) unique ID which allows us to track an “actor” in the system.
2. Generating a Co-Occurrence Matrix from the Session Data
We are interested in entities that frequently co-occur, as we might then infer some kind of interdependence between those entities.
For example, a click event can be described using a click(user, query, document) tuple, and we associate each of those entities with each other and with other similar events within a session. A key point here is that we generate the co-occurrence relations not just between the same field types e.g. (query, query) pairs, but also “cross-field” relations e.g. (query, document), (document, user) pairs etc.
This will give us an N x N co-occurrence matrix, where N = all unique instances of the field types that we want to calculate co-occurrence relations for.
Figure 1 below shows a co-occurrence matrix that encodes how many times different characters co-occur (appear together in the text) in the novel “Les Miserables”.
Each colored cell represents two characters that appeared in the same chapter; darker cells indicate characters that co-occurred more frequently. The diagonal line going from the top left to the bottom right shows that each character co-occurs with itself. You can also see that the character named “Valjean”, the protagonist of the novel, appears with nearly every other character in the book.
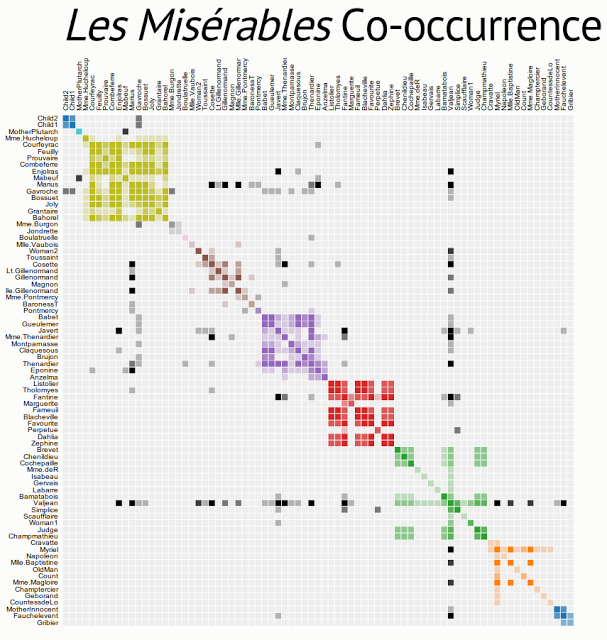
Figure 1. “Les Miserables” Co-occurrence Matrix by Mike Bostock.
In Fusion we generate a similar type of matrix, where each of the items is one of the types specified when configuring the system. The value in each cell will then be the frequency of co-occurrence for any two given items e.g. a (query, document) pair, a (query, query) pair, a (user, query) pair etc.
For example, if the query “Les Mis” and a click on the web page for the musical appear together in the same user session then they will be treated as having co-occurred. The frequency of co-occurrence is then the number of times this has happened in the raw event logs being processed.
3. Generating a Graph from the Matrix
The co-occurrence matrix from the previous step can also be treated as an “adjacency matrix”, which encodes whether two vertices (nodes) in a graph are “adjacent” to each other i.e. have a link or “co-occur”. This matrix can then be used to generate a graph, as shown in Figure 2:
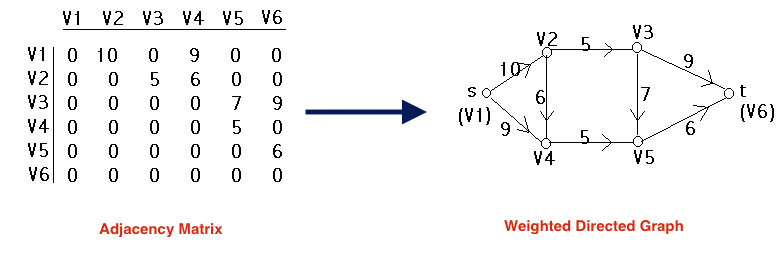
Figure 2. Generating a Graph from a Matrix.
Here the values in the matrix are the frequency of co-occurrence for those two vertices. We can see that in the graph representation these are stored as “weights” on the edge (link) between the nodes e.g. nodes V2 and V3 co-occurred 5 times together.
We encode the graph structure in a collection in Solr using a simple JSON record for each node. Each record contains fields that list the IDs of other nodes that point “in” at this record, or which this node points “out” to.
Fusion provides an abstraction layer which hides the details of constructing queries to Solr to navigate the graph. Because we know the IDs of the records we are interested in we can generate a single boolean query where the individual IDs we are looking for are separated by OR operators e.g. (id:3677 OR id:9762 OR id:1459). This means we only make a single request to Solr to get the details we need.
In addition, the fact that we are only interested in the neighborhood graph around a start point means the system does not have to store the entire graph (which is potentially very large) in memory.
4. Powering Recommendations from the Graph
At query/recommendation time we can use the graph to make suggestions on which other items in that graph are most related to the input item, using the following approach:
- Navigate the co-occurrence graph out from the seed item to harvest additional entities (documents, users, queries).
- Merge the list of entities harvested from different nodes in the graph so that the more lists an entity appears in the more weight it receives and the higher it rises in the final output list.
- Weights are based on the reciprocal rank of the overall rank of the entity. The overall rank is calculated as the sum of the rank of the result the entity came from and the rank of the entity within its own list.
The following image shows the graph surrounding the document “Midnight Club: Los Angeles” from a sample data set:
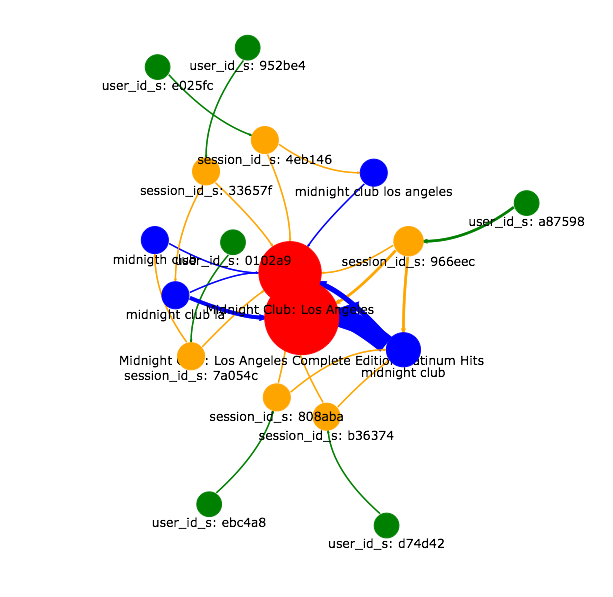
Figure 3. An Example Neighborhood Graph.
Here the relative size of the nodes shows how frequently they occurred in the raw event data, and the size of the arrows is a visual indicator of the weight or frequency of co-occurrence between two elements.
For example, we can see that the query “midnight club” (blue node on bottom RHS) most frequently resulted in a click on the “Midnight Club: Los Angeles Complete Edition Platinum Hits” product (as opposed to the original version above it). This is the type of information that would be useful to a business analyst trying to understand user behavior on a site.
Diversity in Recommendations
For a given item, we may only have a small number of items that co-occur with it (based on the co-occurrence matrix). By adding in the data from navigating the graph (which comes from the matrix), we increase the diversity of suggestions. Items that appear in multiple source lists then rise to the top. We believe this helps improve the quality of the recommendations & reduce bias.
For example, in Figure 4 we show some sample recommendations for the query “Call of Duty”, where the recommendations are coming from a “popularity-based” recommender i.e. it gives a large weight to items with the most clicks. We can see that the suggestions are all from the “Call of Duty” video game franchise:
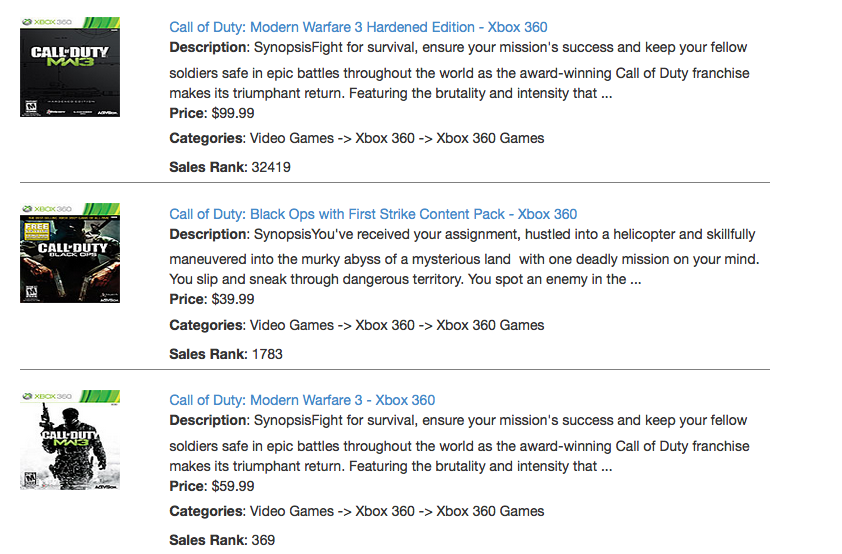
Figure 4. Recommendations from a “popularity-based” recommender system.
In contrast, in Figure 5 we show the recommendations from EventMiner for the same query:
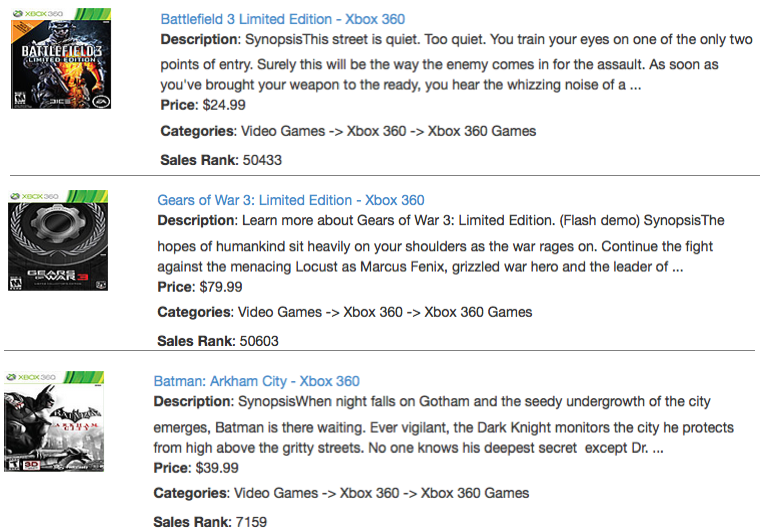
Figure 5. Recommendations from navigating the graph.
Here we can see that the suggestions are now more diverse, with the first two being games from the same genre (“First Person Shooter” games) as the original query.
In the case of an e-commerce site, diversity in recommendations can be an important factor in suggesting items to a user that are related to their original query, but which they may not be aware of. This in turn can help increase the overall CTR (Click-Through Rate) and conversion rate on the site, which would have a direct positive impact on revenue and customer retention.
Evaluating Recommendation Quality
To evaluate the quality of the recommendations produced by this approach we used CrowdFlower to get user judgements on the relevance of the suggestions produced by EventMiner. Figure 6 shows an example of how a sample recommendation was presented to a human judge:
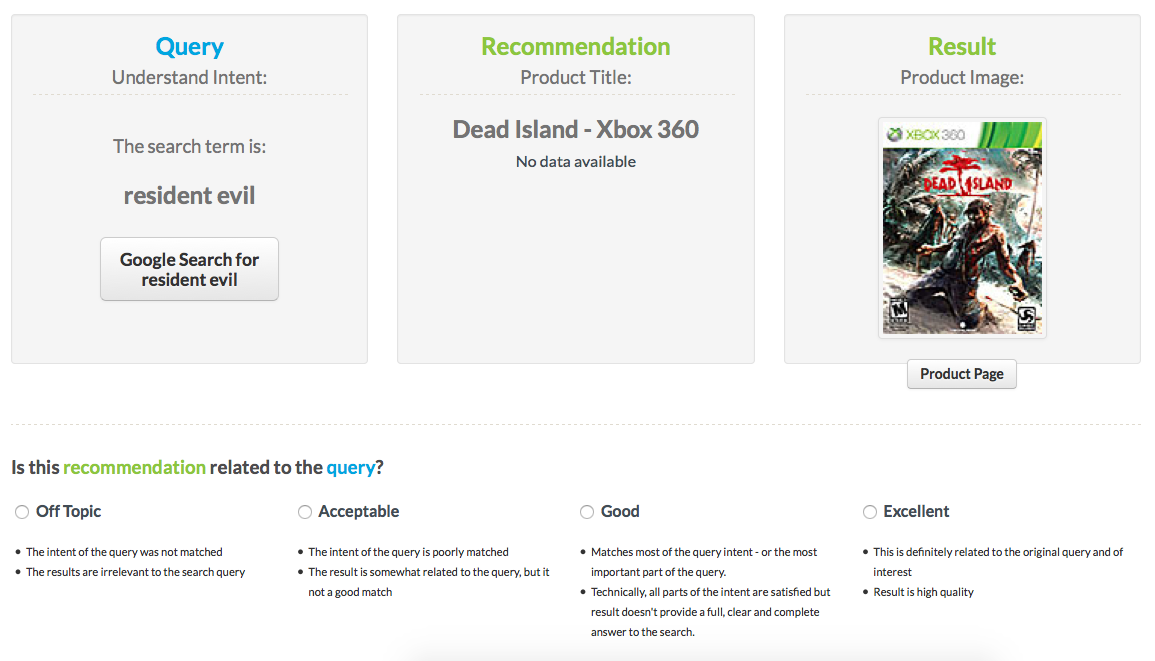
Figure 6. Example relevance judgment screen (CrowdFlower).
Here the original user query (“resident evil”) is shown, along with an example recommendation (another video game called “Dead Island”). We can see that the judge is asked to select one of four options, which is used to give the item a numeric relevance score:
- Off Topic
- Acceptable
- Good
- Excellent
In this example the user might judge the relevance for this suggestion as “good”, as the game being recommended is in the same genre (“survival horror”) as the original query.
Note that the product title contains no terms in common with the query i.e. the recommendations are based purely on the graph navigation and do not rely on an overlap between the query and the document being suggested.
In Table 1 we summarize the results of this evaluation:
| Items | Judgements | Users | Avg. Relevance (1 – 4) |
| 1000 | 2319 | 30 | 3.27 |
Here we can see that the average relevance score across all judgements was 3.27 i.e. “good” to “excellent”.
Conclusion
If you want an “out-of-the-box” recommender system that generates high-quality recommendations from your data please consider downloading and trying out Lucidworks Fusion.