Monitoring Apache Solr and Lucidworks with Zabbix
If you’re running Apache Solr in production, you count on it to deliver solid performance and expect it to be up at all times. Even if you tested your setup with expected data and query load, things can go wrong. Solving those problems as they appear, not only causes service downtime, but is a very unpleasant task. Imagine sleepless nights trying to figure out why your production system went down with an OutOfMemory error. Similar situations are actually more common than desired – no free disk space, running out of file descriptors, no free memory for OS level file system cache, high cpu load and so forth.There is special class of software programs called monitoring software that are widely used among system and network administrators. In our case we would like to monitor not only OS level metrics, but also Solr internal parameters and act accordingly.
Lucidworks and Apache Solr provide lots of valuable information through a JMX interface, so you can hook that up into your monitoring tool.
Zabbix is one of the most popular open source monitoring tools. It has many features like an easy-to-use web interface, different ways to gather metrics data, an ability to keep this data in persistent storage, built-in graphing, notifications and alerting, flexible configuration and many more. One of the most compelling features of integrating it with Apache Solr is built-in JMX support (available only in Zabbix 2.0 beta release). Using this feature you can easily configure Zabbix server to pull JMX metrics out of any Lucidworks or Solr application. This is because all configuration settings (JMX attributes, graphs, triggers) are stored centrally on a Zabbix server, which means you can add a new attribute for all monitored servers or change the pulling frequency for servers with a single click.
Here are example graphs you can build in Zabbix:
1. Total number of documents in Solr index

2. Search activity – number of search requests, errors and timeouts

Solr request handlers provide cumulative counter for number of requests, but you are probably more interested in number of search requests per specific period of time, like per minute or per second. The trick here is that Zabbix provides a way to setup monitoring to store not the value as-is, but as a delta (simple change value or speed per second).
3. Solr document operations (adds, deletes by id or query)

4. Crawling activity

Lucidworks provides different connectors/crawlers which you can use to index documents into Solr. It also provides additional statistics about crawler behavior, like total number of documents, new and deleted documents, number of updated documents in iterative crawl, failures, etc.
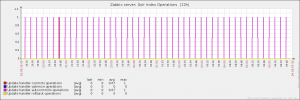
5. Solr index operations (commits, optimizes, rollbacks)

6. Search Average Response Time

Solr search request handler provides cumulative avgTimePerRequest value. The problem with this attribute is that when your applications is running in production for a significant amount of time, current short term performance problems won’t cause significant effect on this aggregate metric. The solution is to use a Zabbix calculated item on delta change for totalTime and requests attributes. Here’s math expression to calculate average search response time for the last 5 minutes:
sum("jmx["solr/collection1:type=/lucid,id=org.apache.solr.handler.StandardRequestHandler","totalTime"]",300)/sum("jmx["solr/collection1:type=/lucid,id=org.apache.solr.handler.StandardRequestHandler","requests"]",300)
7. Solr searcher warmup time

This is an important metric if you pursue fast commit rate (near real time indexing) and don’t want to sacrifice fast faceting performance. You can configure monitoring tool to send alert in case of warmup time exceeds some pre-defined threshold.
8. Filter, query results and documents caches statistics (cache size, hits, hitratio, evictions, etc)


9. Java Heap Memory Usage

How would I know if my search server is down?
There are two options – the obvious one is to set up your monitoring tool to issue search requests and verify response status or specific text on a search results page. Another option is to check the last time your monitoring tool retrieved an arbitrary JMX attribute from your application and assume the server is down if it’s longer than expected. In Zabbix there’s special function nodata which you can use to achieve that.
How would I know if I’m reaching a limits of my server and pro-actively react on this?
This is a complex issue as there are many things that can go wrong (such as JVM heap memory, CPU load, disk space, file descriptors, etc.) and you should monitor them all. Zabbix has great example templates for OS and Java triggers that allow you to keep an eye on all those parameters.For more information about Solr and Lucidworks JMX support, instructions how to configure Zabbix and Nagios, Zabbix configuration templates and other helpful tips please see the Integrating Monitoring Services section on Lucid documentation portal.