The Power of User Signals
Your team is already collecting user signals from your applications. Clickstream, views, downloads, conversions, purchases… you’re grabbing every bit of user behavior for safekeeping and analysis. But what do you do with the ever-growing mountain of data? At this year’s Activate, Lucidworks data scientist Jill Rosow helped us put on some floaties and dive into the pool.
Data is a Story
The first challenge is aggregating and assembling all this data into a mature narrative. You’ve got lots of trees – now you need to try and see the forest. Let’s take a look at several avenues for investigation to better understand how users are interacting with your application and how to tease out where there’s room for improvement.
The Analytics Maturity Curve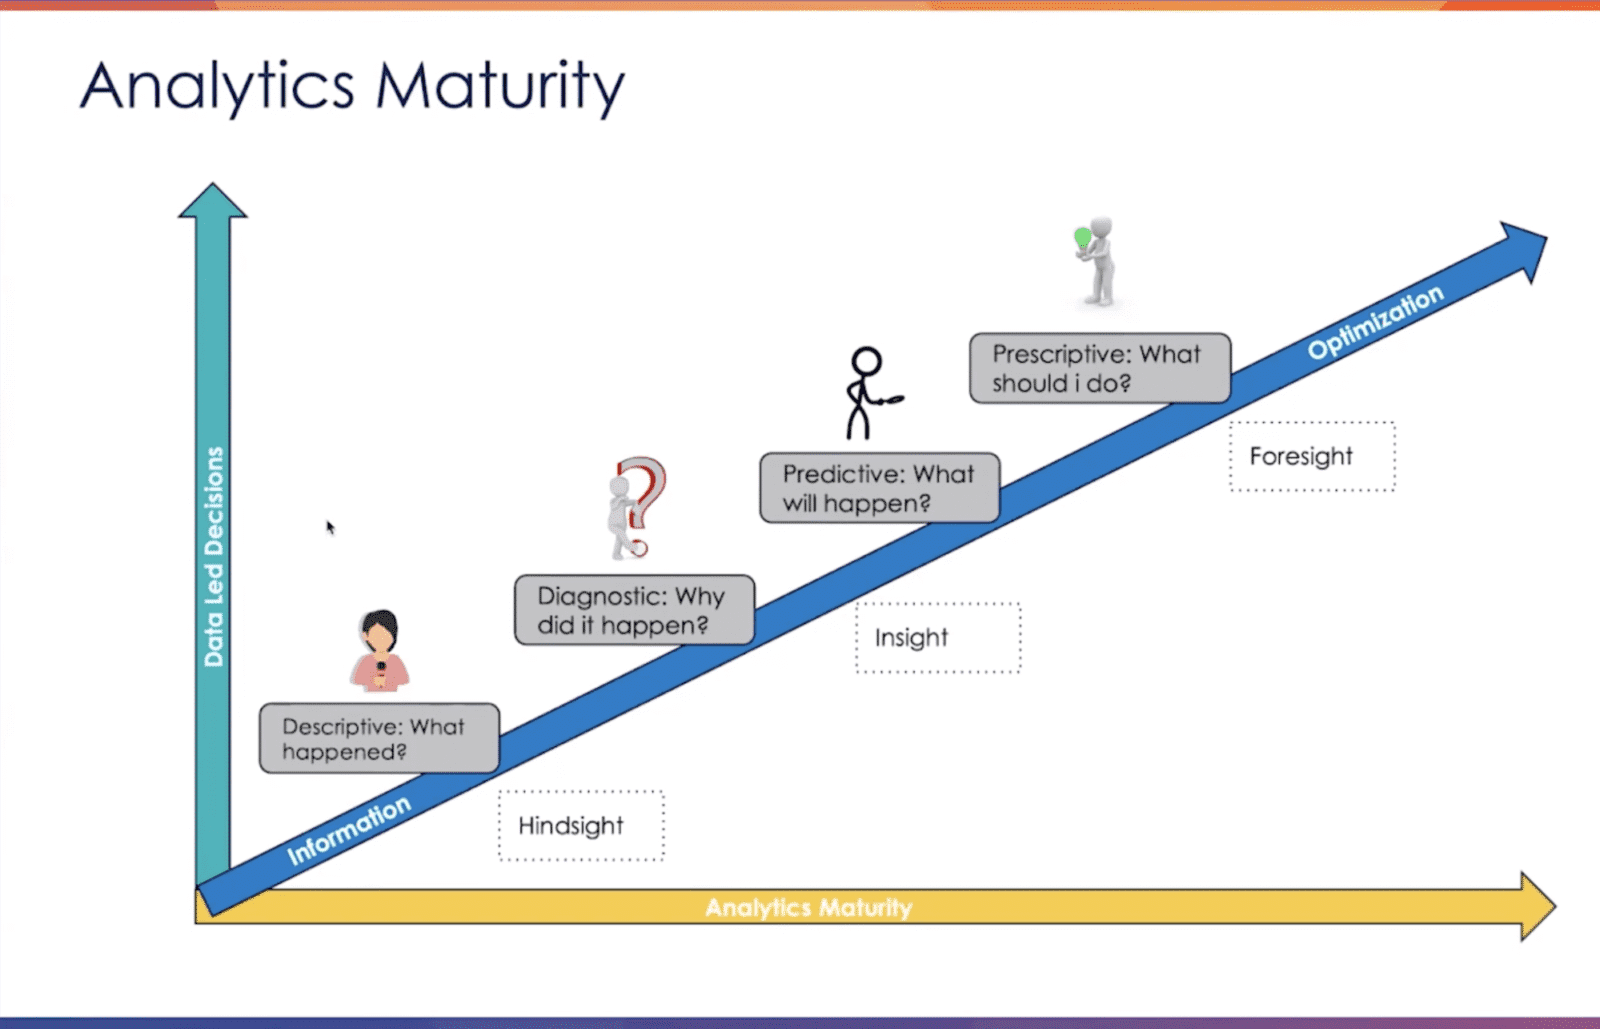
One way to get a birds-eye view of things is to see where you are on our Analytics Maturity spectrum. This is a way to quickly see what your current state is in terms of the analytics of your search applications. What you’ve already done, and where you could go next.
This model goes beyond your typical KPIs like app performance, conversion rate, case deflection rate, average basket value… though of course it is crucial to track these metrics and make sure that your business is hitting these targets. But, these are quantitative measures. They’re going to be strongly influenced by outliers and they often don’t show us the specifics
Here’s four stages on the analytics maturity curve. Which stage best describes how you currently approach analytics for your search applications?
- Descriptive. Looking at the data up close and in detail to answer what happened?
- Diagnostic. What does the data tell us about why it happened?
- Predictive. What is our analysis telling us about what will happen next?
- Prescriptive. Knowing all that, how can I predict what I should do next?
Think about where your applications sit on the maturity spectrum – and how you might get to the next stage.
Users Want to Feel Understood
At the root of analyzing user signals is our need to be understood. We know as consumers – and as business professionals – how it feels when the systems we use are understanding what we’re trying to do and help us do it faster and easier. To achieve this quality of user experience, we as search engineers need to move our thinking from centering our relevancy techniques around queries and keywords, and more on relevancy analysis/improvements around the individual user. All this while keeping in mind each unique user has differing affinities, goals, and preferences. Users can tell when a system is treating them like one in a million or one of a million.
Example avenues for investigation might include:
- How can I learn from the users that are already interacting with my platform on every single day?
- What are my users asking for? What are they searching for the most?
- What category of products or files do they browse and search most frequently?
- Are they finding their way to what they’re looking for easily or are there roadblocks in their way?
Here’s an example showing the search distribution for the top 25 brands in a dataset from an ecommerce retailer:
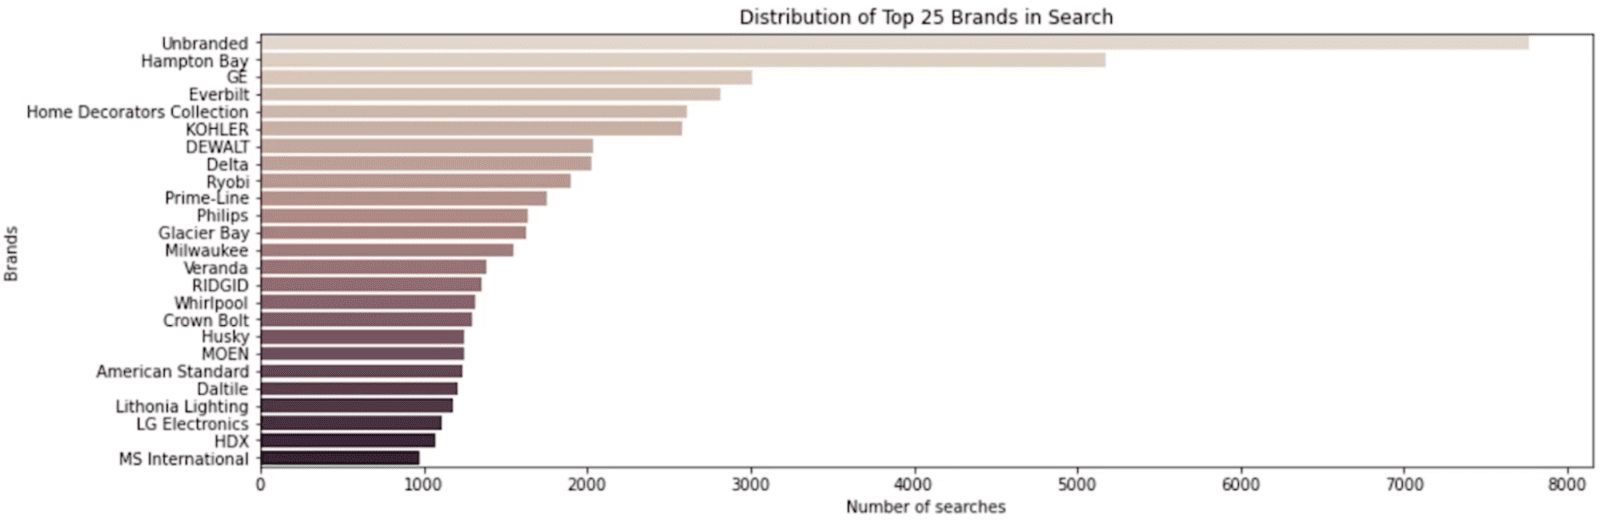
Searches in this case are queries, but they could come from other sources that could be support cases, emails, phone calls. You should analyze any and all sources of this type of data. Most of the users here are searching for products without a specified brand. This could indicate that you may have a data quality problem. Since this is the largest category of searches, I would likely dig into this segment individually and try to further define the data quality problem in order to measure the impact to our search relevancy.
Then behind our unbranded category, we see Hampton Bay brand products searched for most frequently, followed by GE and Everbilt. Since these are our top categories, we should ensure the brand landing pages and assortments for these brands are running optimally, as they’re the most frequently encountered and will therefore account for a lot of our search opportunities.
Words, Words, Words
The clicks, scrolls and usage numbers give you one angle of analysis, but what about diction – the literal words that users are entering as queries?
Starting with the top 20 words overall is probably too broad, so one place to start is with trigram analysis. Trigram analysis looks for unique combinations of three words and reports how often they are used in queries. This can be useful for customer support portals and other applications where users ask longer questions with longer strings of text. Here’s a trigram analysis for an appliance vendor:
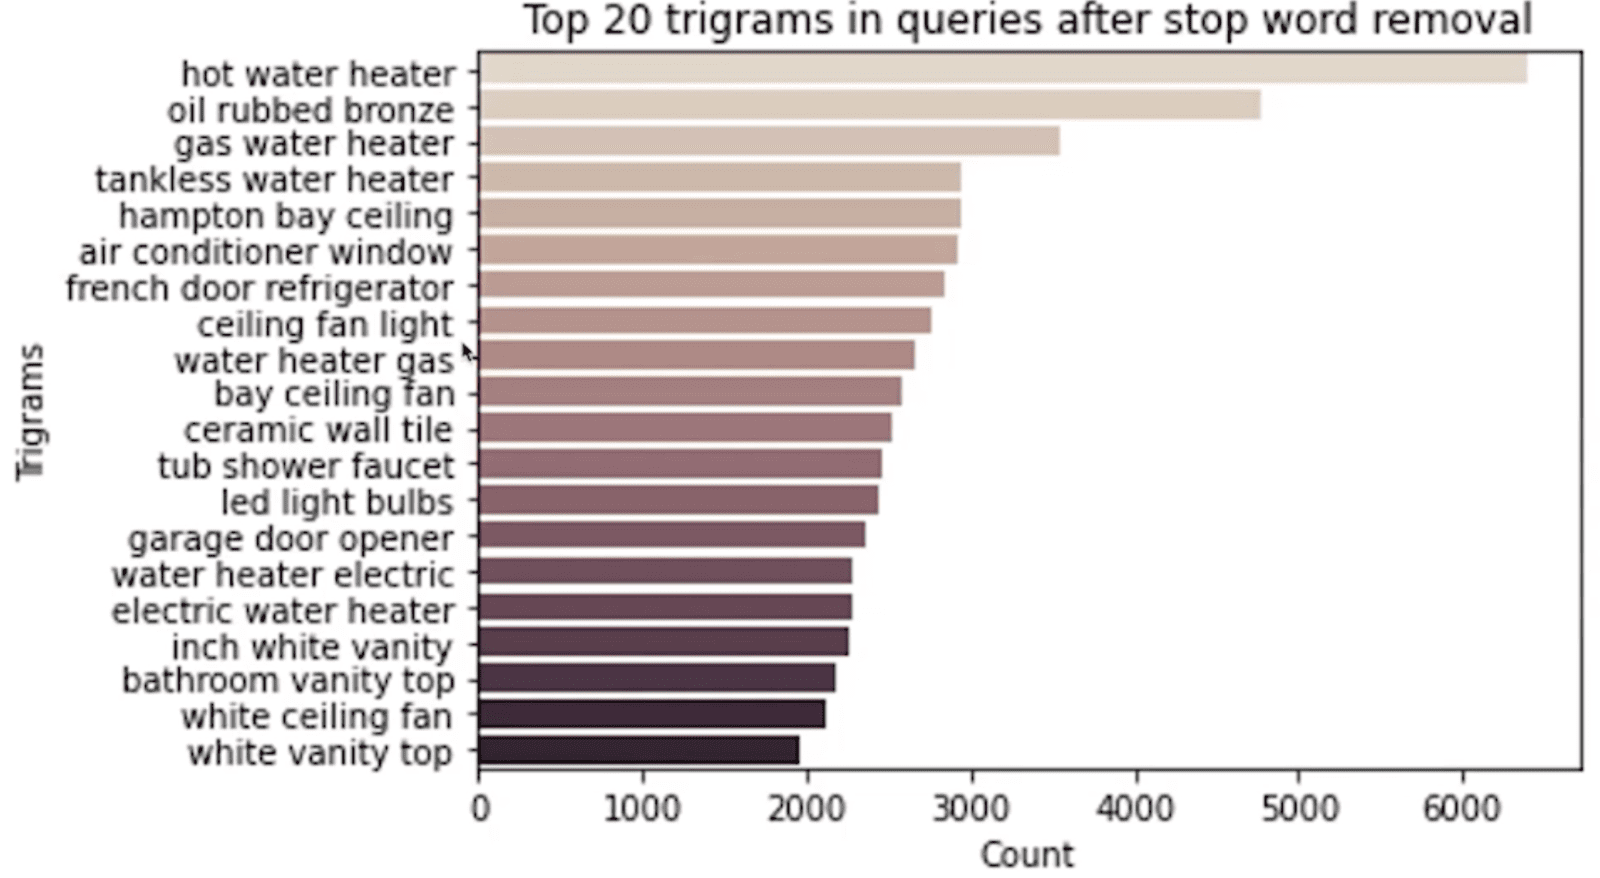
When we look at these top 20 trigrams, we start to see some themes emerging. There are a lot of mentions of water heaters in various places, but we can also see that when a user searches for a water heater, they’re typically going to specify even further the exact type of water heater they’re looking for. We see hot water heater, gas water heater, tankless, electric… these customers are getting very specific with modifiers when they’re looking for a predetermined product. One avenue of analysis could be asking if the language of our consumers changes based on what product category they’re searching?
Here’s an example of bigram analysis (two token sequences) on a different dataset – queries of two insurance categories, annuities and home insurance:
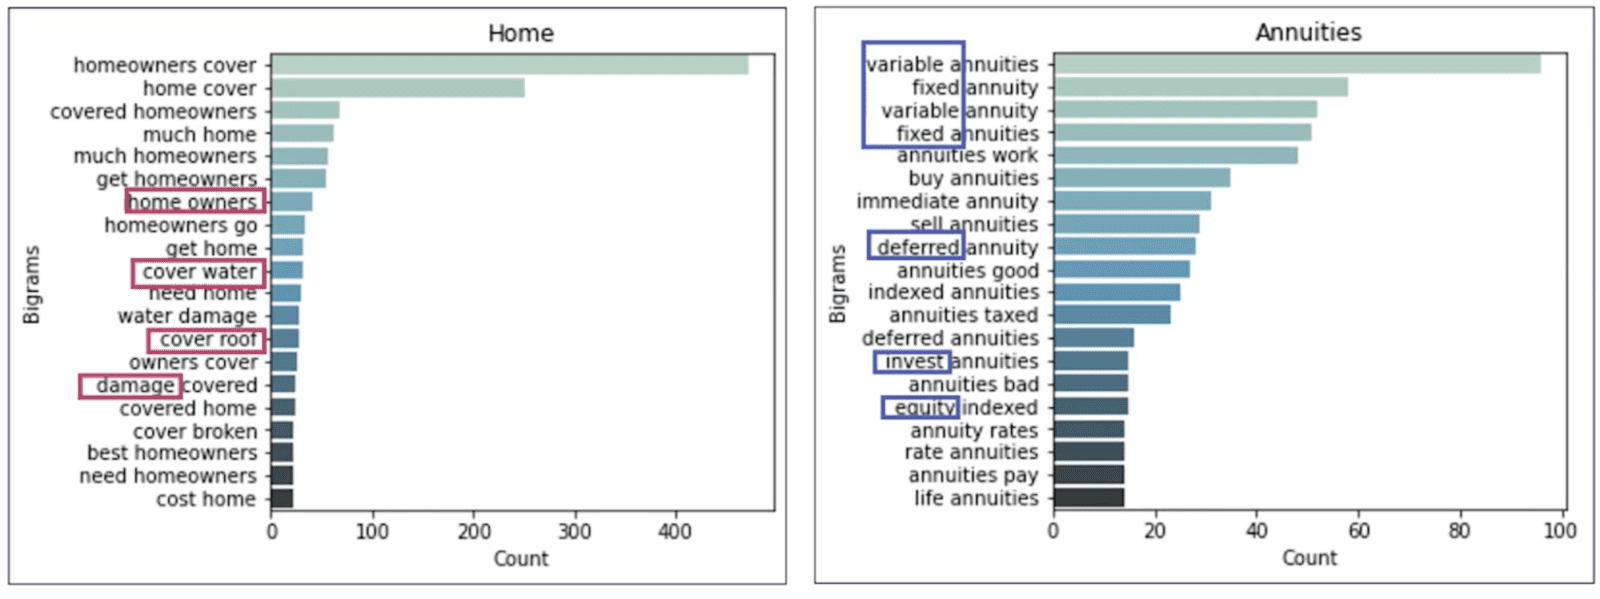
The top bigrams indicate how the language really changes depending on the category of insurance products being discussed. You can see that when consumers are curious about annuities, they typically ask questions around investments, deferrals, equity, and concepts like fixed versus variable. This is very different from what we see in the home insurance category. These users tend to wonder about things like damage, water coverage, costs, and concepts like owners versus renters. These insights can help us understand how our users’ intent changes depending on what product category they are searching in and shopping for.
Users Want Answers in the Moment
In addition to wanting to be known and understood, users want answers. And they want them immediately and where they are in the moment: website, social media, online chat, in-store, in-app, on the phone – doesn’t matter where. They ALSO want their history and activity synchronized across all these channels. If they searched the support portal before calling the hotline, the rep in the contact center should see that as soon as they pick up the phone– they shouldn’t have to query five different systems to get a clear picture of the customer’s issue.
Finally, making all these interactions seamless across channels is going to require you to track and analyze what your users do both before and after submitting a ticket or getting a zero search result. Were they browsing? Did they revise their query and try a second time? Do any of your zero results queries indicate new areas for content development or optimization?
Connect the Dots, Map the Journey
It is only by connecting these interactions across these various touchpoints that your team can get an overview of the customer journey from browse to shop to purchase to support. Start to look for points of interception before things go wrong. Did the customer browse the site before opening a ticket? Why didn’t they go into the support docs? Where were they before they filed a ticket? How did they change and narrow their queries? How can you make that easier for the next user that heads down that path?
Empowered Problem Solvers
More than anything else, consumers want to feel like empowered problem solvers. That they are empowered to solve their own problems and make purchases without involving support. Empowered customers are happy and loyal customers. Ways to interrogate this include the questions:
- Do users have all the knowledge available at their fingertips, as well as the ability to quickly sort through this information and find relevant results?
- Can users access these differing types of information from the same interface – a unified search?
- If they have access to all the data they ended, can they find the relevant information?
Watch Out for Synonyms
Many times users don’t know the right words to use so they stumble through. Here’s a graph of queries for an insurance company’s portal:
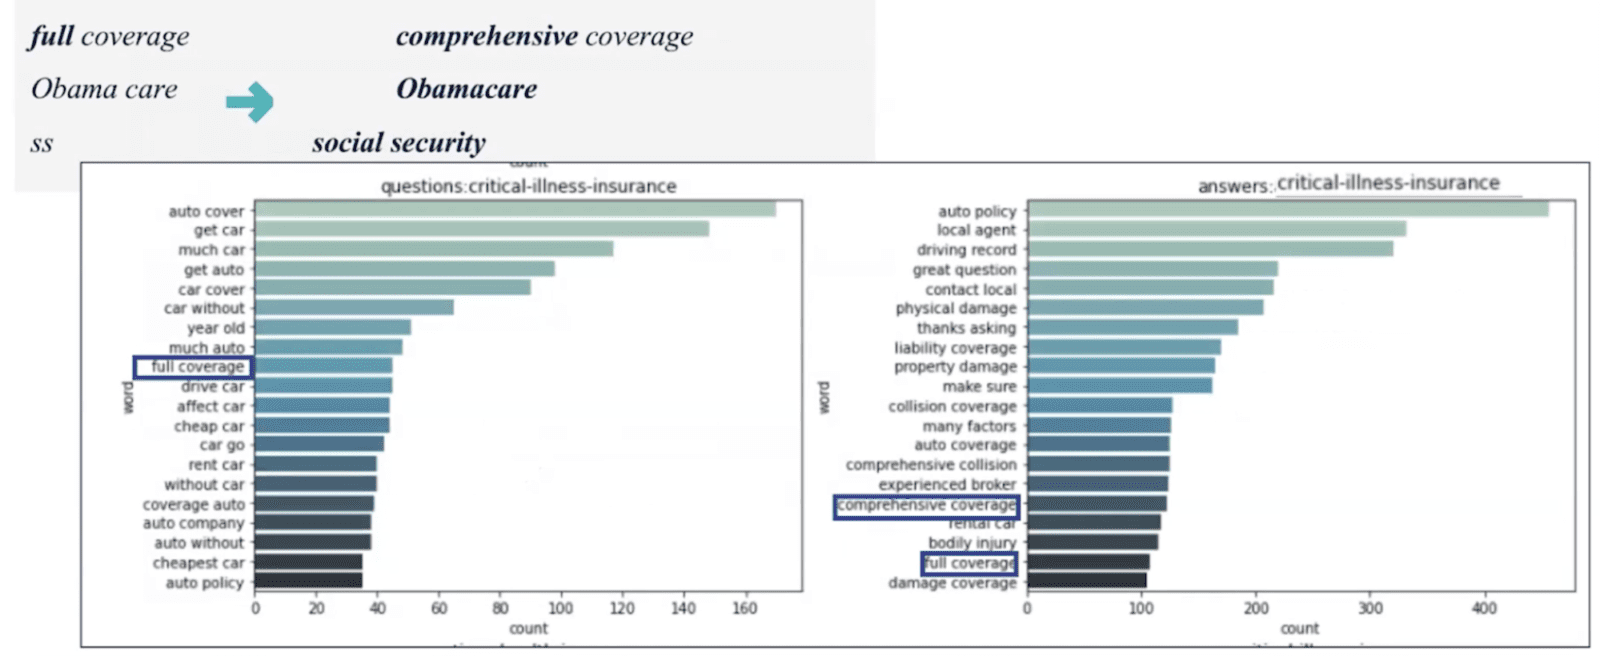
On the left are queries from customers about the firm’s critical insurance offerings. Users are using the term full coverage as they search. On the right is the frequency of similar terms in the company’s knowledge base where what users call full coverage is technically called comprehensive coverage. Ideally you’d include both as synonyms to increase recall in a user’s search results.
Examine Repetitive Queries
Be sure to look at repetitive queries. If several support agents are searching for the same thing, recommend the similar solved cases to get them closer to resolution. In addition, the frequent queries your support agents submit from their dashboard are probably also frequent queries in your customer-facing search. Consider analyzing the two sources side by side to understand if customers and agents may benefit from each others’ signal data.
Show Me What I Want (Not What I Said)
Finally, let’s talk briefly about how you might address all of the previous use cases – query correction, expansion, augmentation, and recommendations – using just a single solution: semantic vector search. Semantic vector search can be summed up best as:
Show me what I want, not what I said!
This approach lets users search the way they naturally speak (also known as natural language processing) and the system figures out what they really meant. This goes beyond matching off keywords and employs deep learning algorithms to find the semantic meaning from both the query from the user and the data that has been indexed. User signals and other interaction data can be great training data for the algorithms and help address new low-performing searches in real time. These techniques move us further up that maturity curve.
You’re Never Finished
After you’ve put these ideas to work, what’s next? Now that you have this feedback loop in place and you better understand your current state and why it is the way it is, you’re going to continue to analyze that information, iterate on analytics, and improve search relevancy. With continuous analysis, you’ll be able to see when things are working and when they aren’t. Your users are ultimately the ones interacting with your new solutions–let them show you why (or why not) it’s working.
Need help unraveling the story your users are trying to tell you? Get in touch with us today.