Results of 2016 Solr Developer Survey
The results are in! We’ve got the results of the 2016 Solr Developer Survey – thank you to everyone that participated. It really helps us to see a snapshot in time of the vibrant Solr community and how developers all over the world are doing amazing things with Apache Solr.
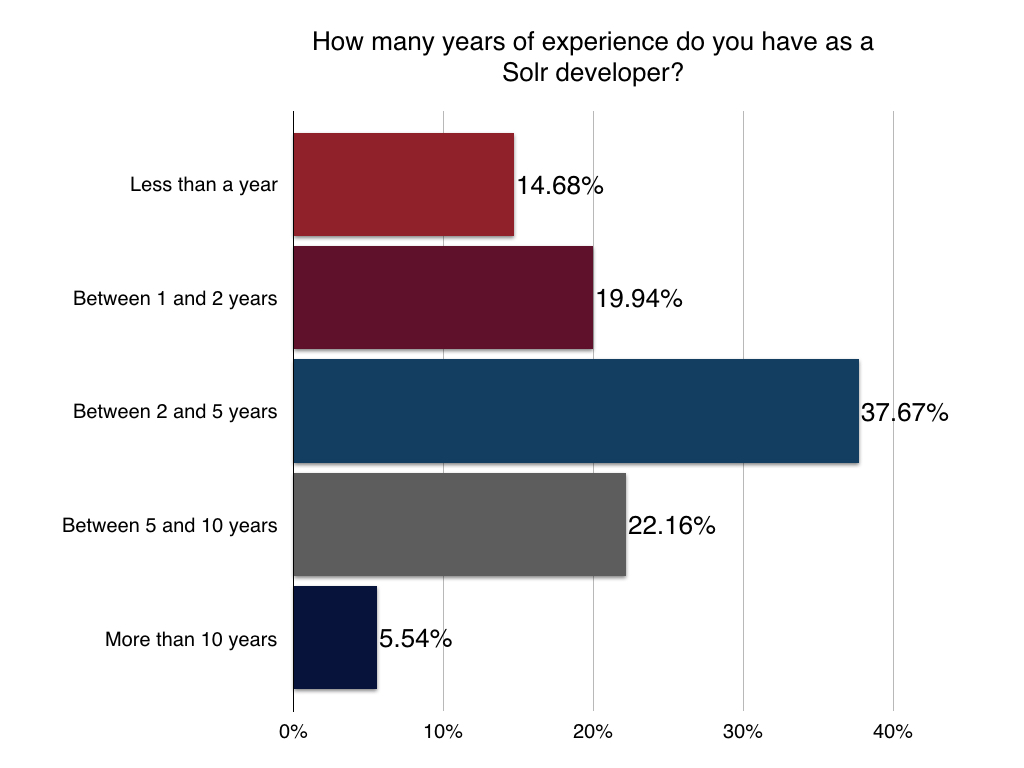
Basic Demographics
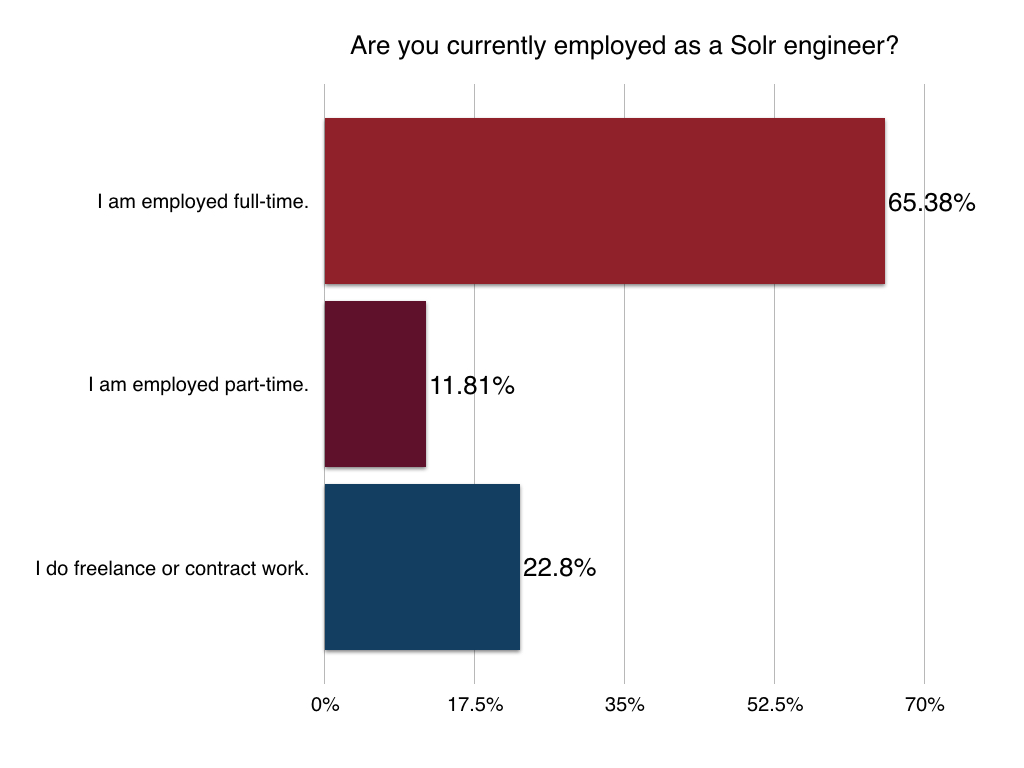
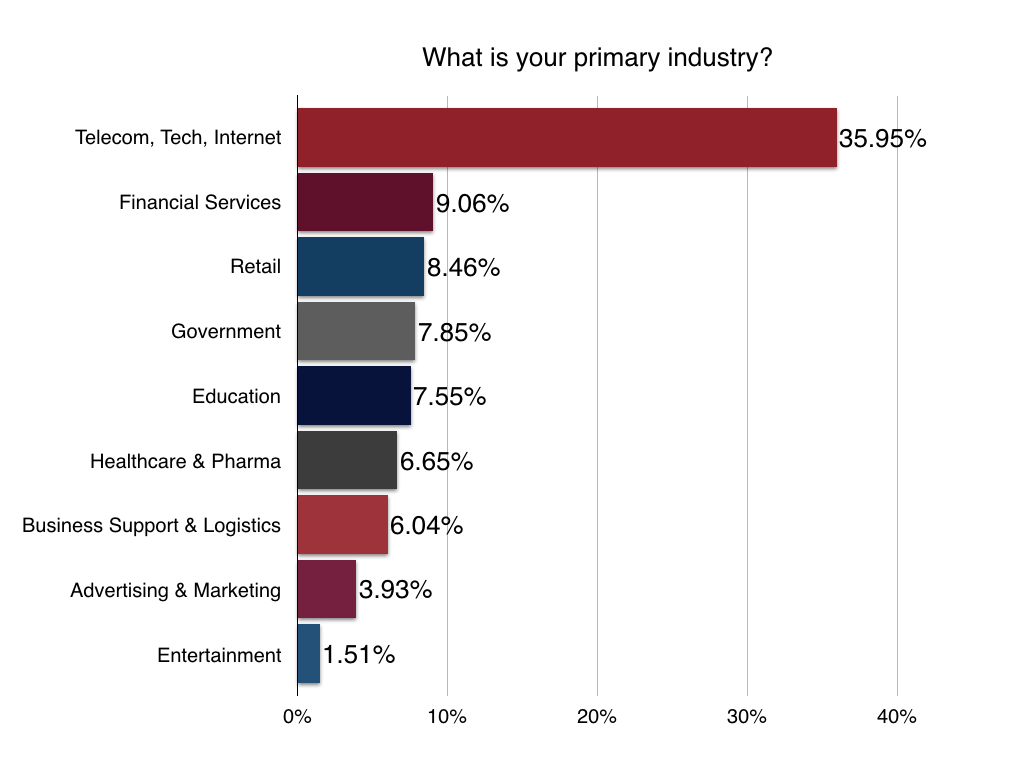
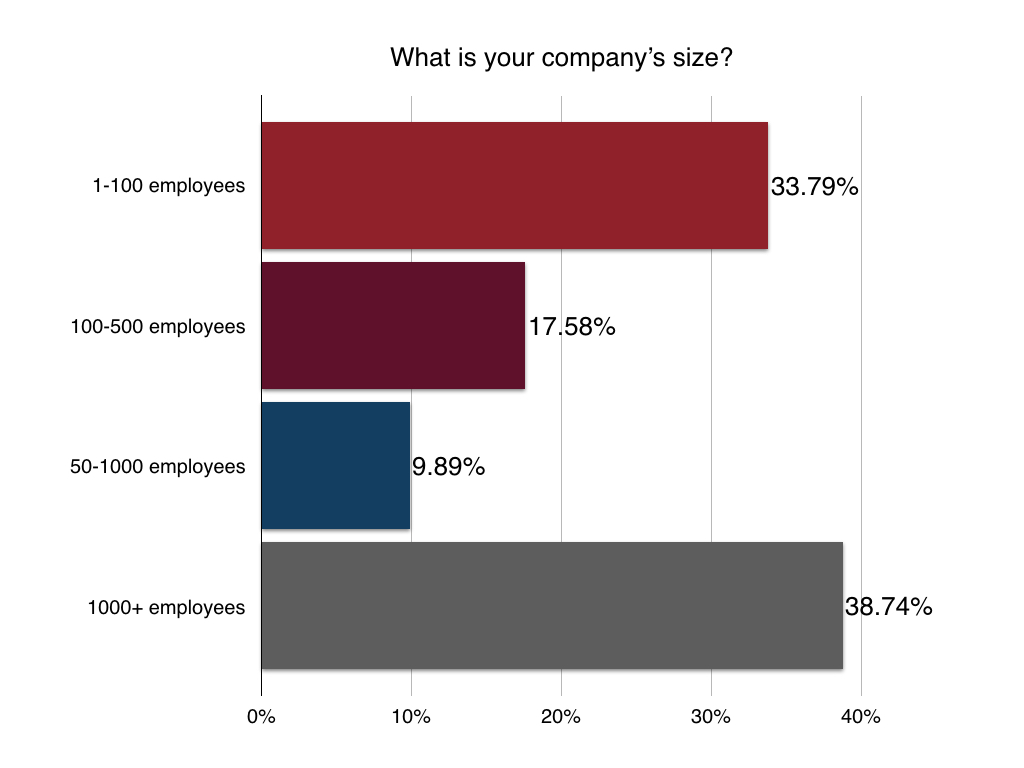
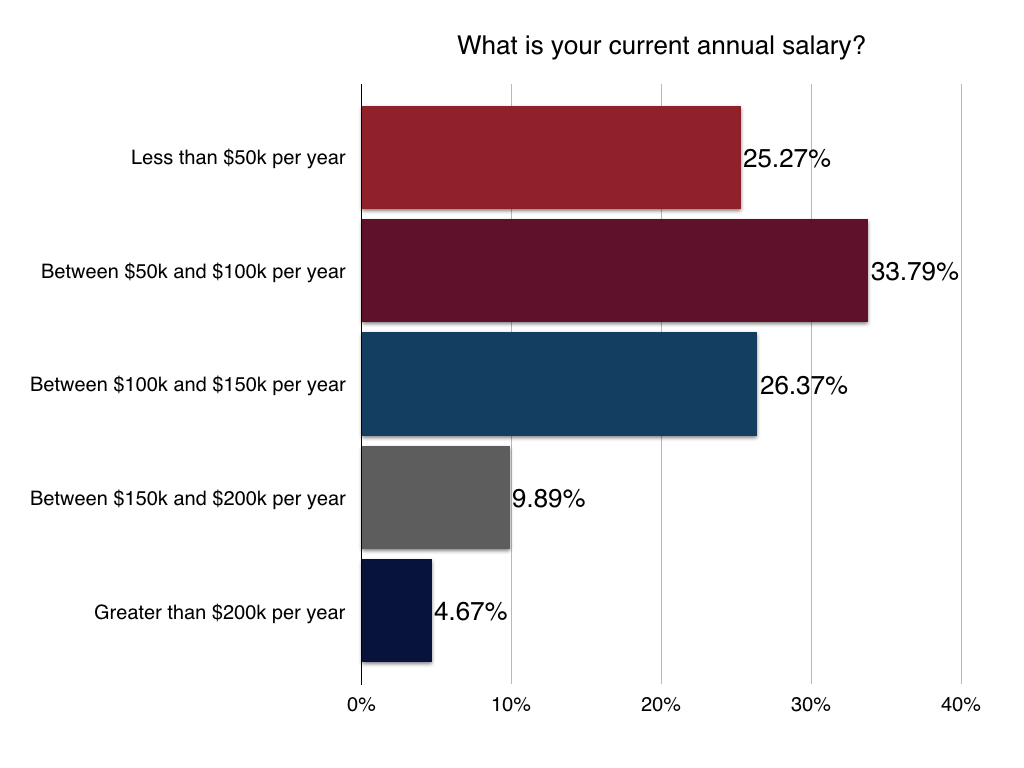
We kicked off the survey asking some basic demographic questions education, salary, industry, etc.
Most developers work full-time in technology/telecom and have a graduate-level education. More details below:
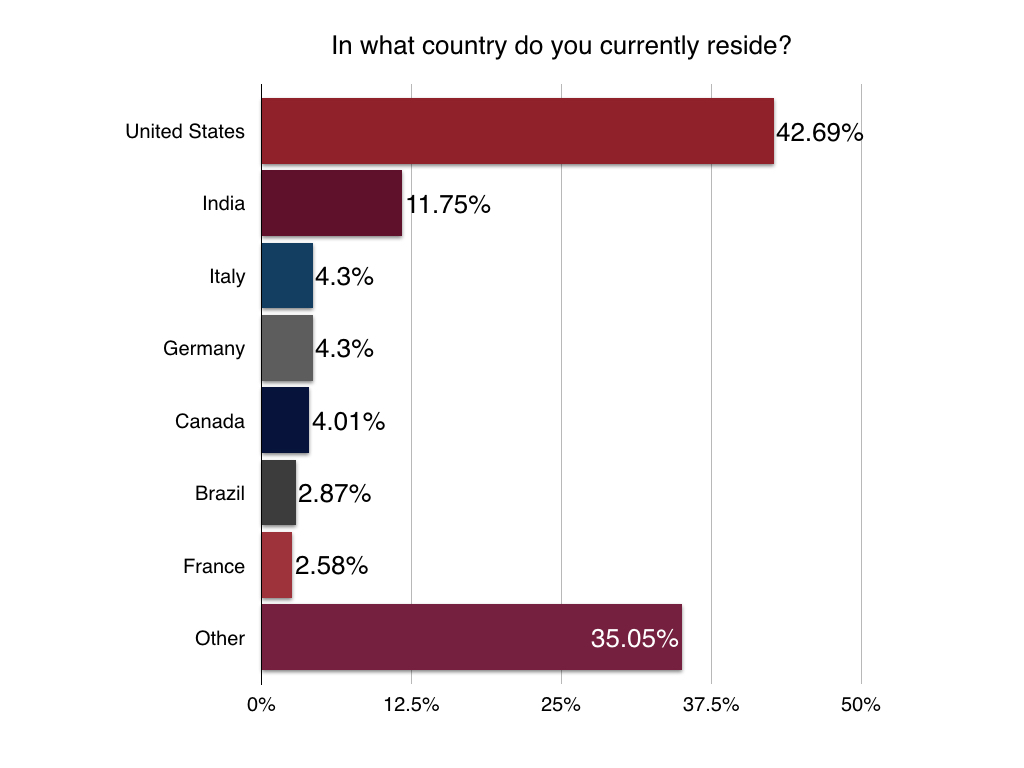
Location
Not surprisingly, most of our developers surveyed live in the United States with India a close second. Italy, Germany, and Canada following after that.
Version of Solr
We’re always curious about this one: Who is still working with older versions of Solr? It’s good to see Solr 5 moving up to the head of the pack – with some developers still having to create or maintain apps built on Solr 1.4 (released back in November of 2009). 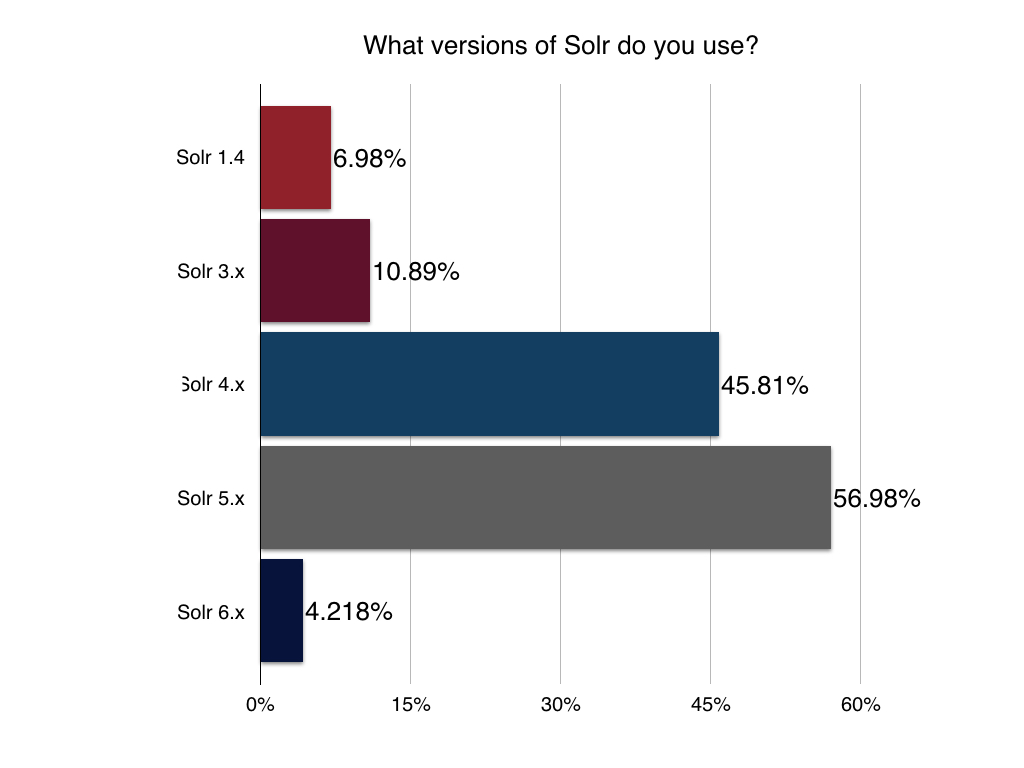
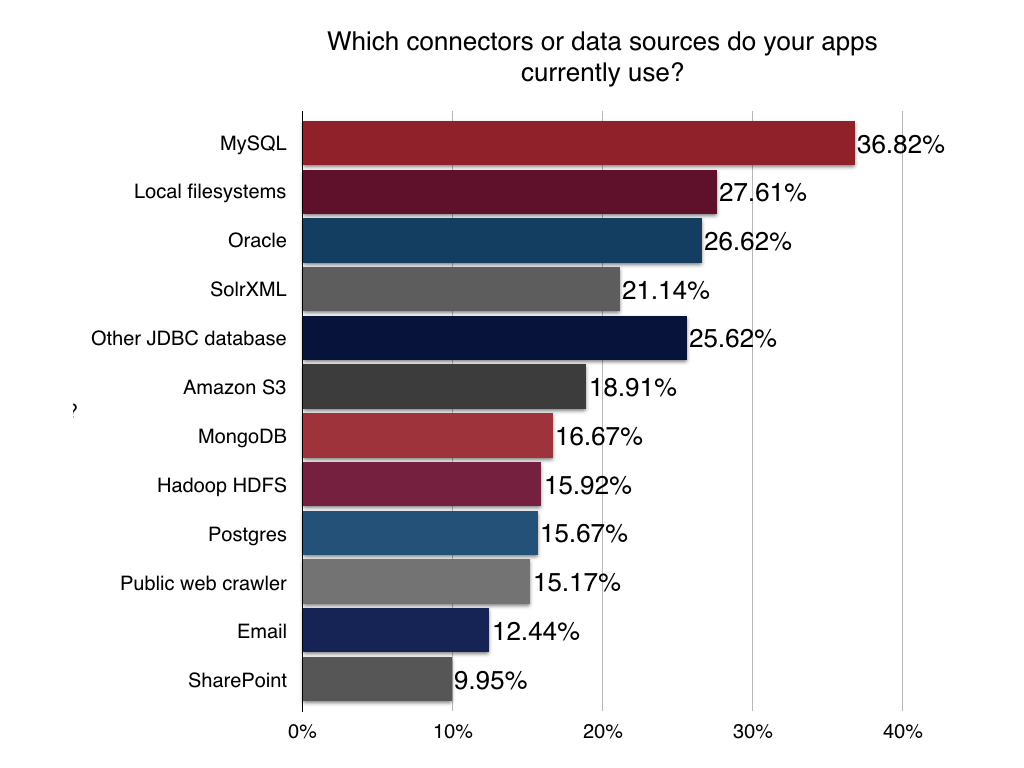
Connectors and Data Sources
Before you can search your data you’ve got to get it into your Solr index. We asked the Solr developer community what connectors they relied on most for bringing their data sources into their Solr instance ready for indexing. MySQL and local filesystems like internal network drives and other resources were at the top – no surprise there. Other database technologies rounded out the top data sources with Amazon S3, the public web, and Hadoop all making an appearance.
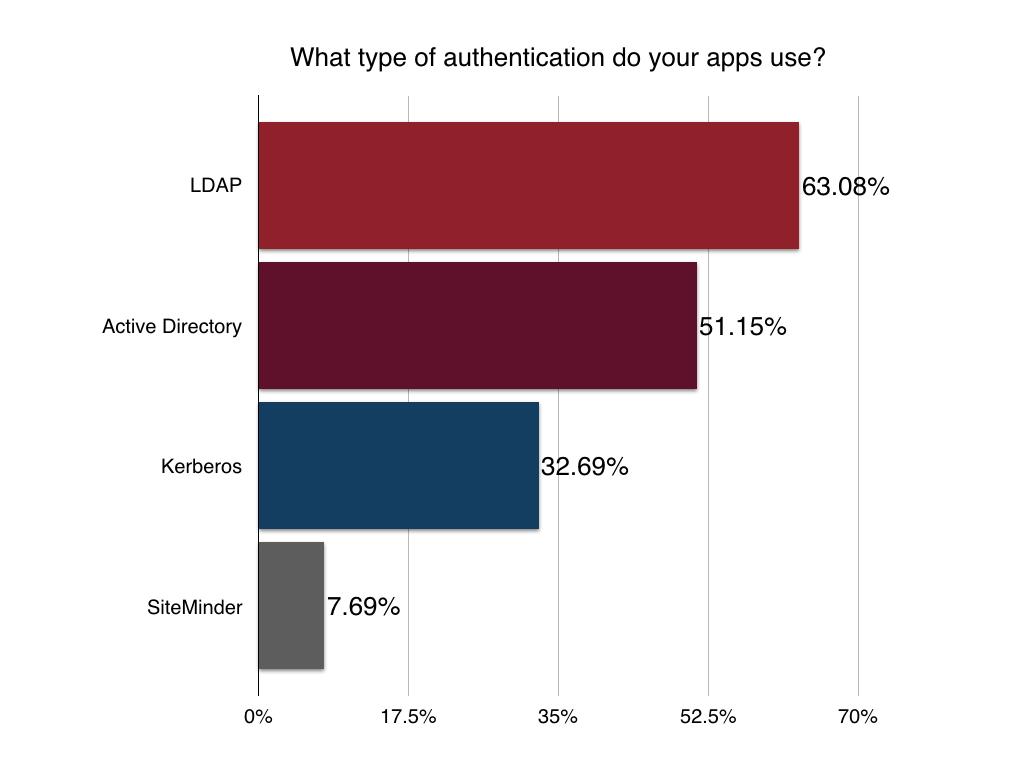
Authentication, Security, and Redaction
Security is paramount when building search-driven applications that are created for a larger user base. The most popular authentication protocols are pretty much standard across the board for most developers: LDAP, Kerberos, and Active Directory, but this year we added SiteMinder as an option. Glad we did.
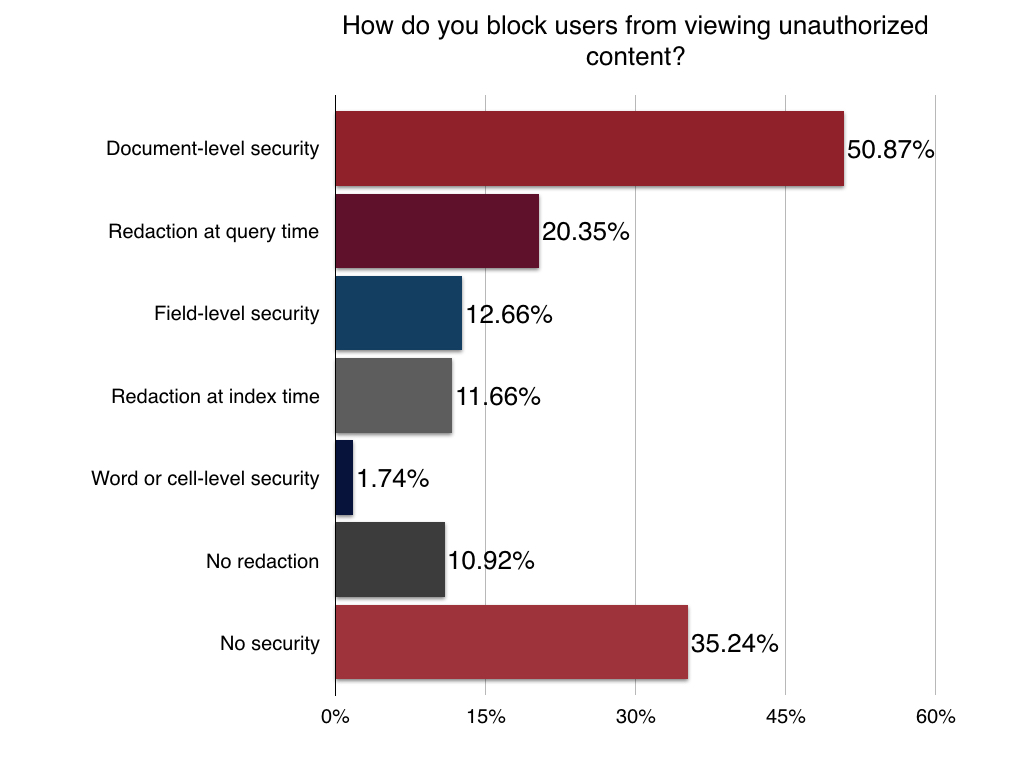
We also wanted to know what levels and complexity of security that developers were using to block users from viewing unauthorized content. 40% said that they had no level of security – which is more than a little distressing. About the same amount had deployed document level security within a search app with other levels and methods following:
UI Frameworks
It’s always a thorny topic asking developers what frameworks they are using for their application. No surprise to see jQuery at the top with AngularJS.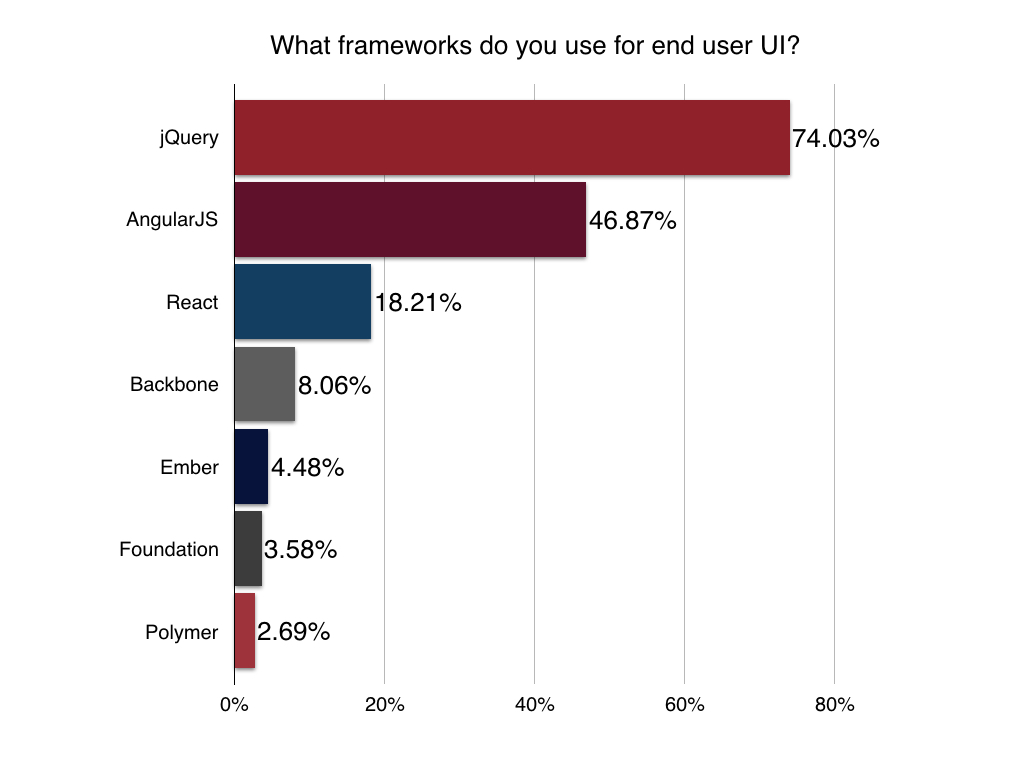
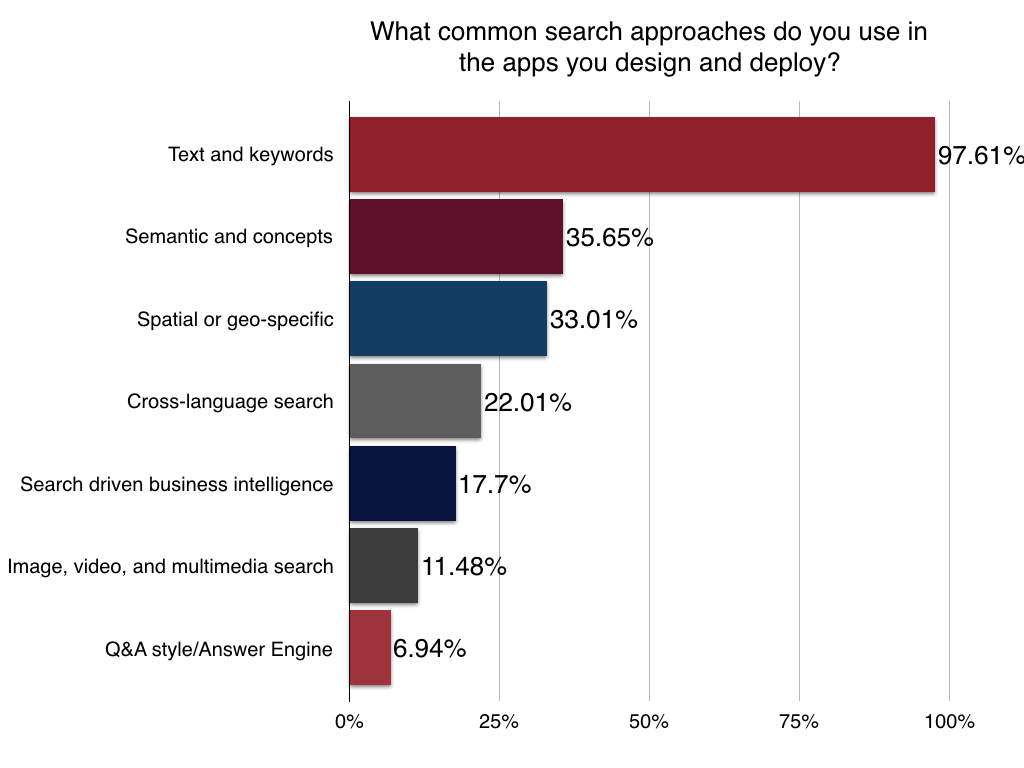
Query Types
The survey also included a question to gauge the level of sophistication of query types apps that developers were including in their Solr apps. Text and keyword search was obvious and remains the foundation of most search projects. It was good to see representation for semantic and conceptual search becoming more prominent. And as mobile devices continue to take over the world, spatial and geo-specific search is more important than ever in helping users find people, resources, products, and services, and search results that are around where they are right now.
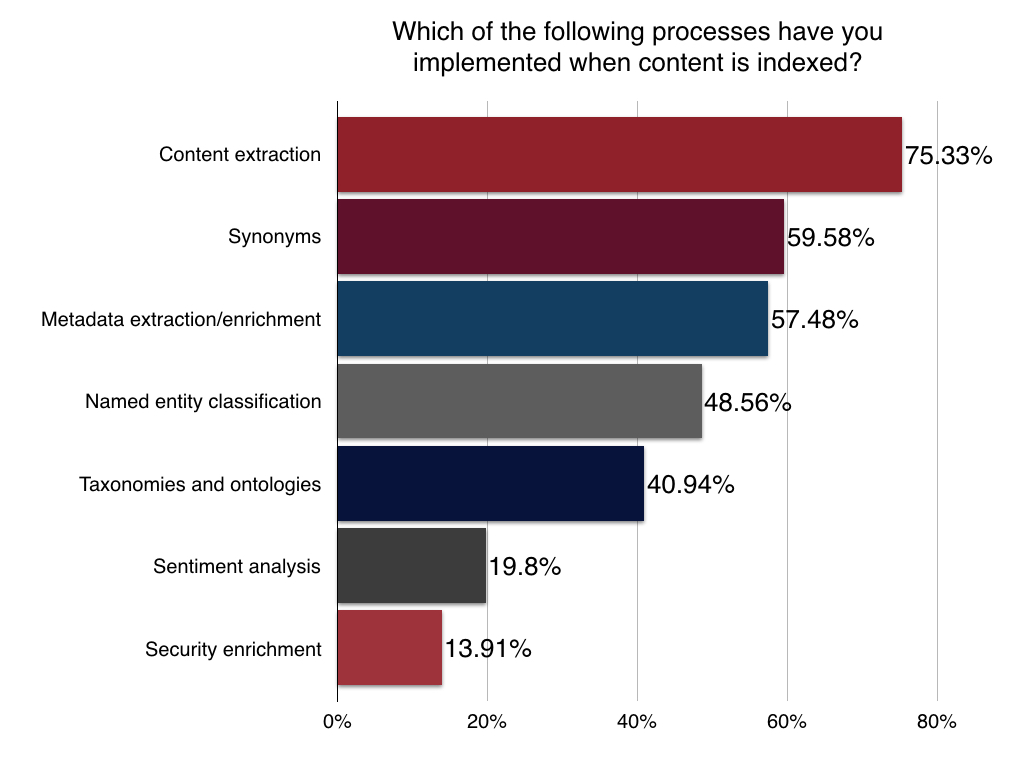
ETL Pipelines and Transformations at Indexing Time
We also wanted to know a little about what types of transformations Solr apps were performing at indexing time. The top transformations were pretty common across those surveyed – at between 40% and 75% – included synonym identification, content extraction, metadata extraction and enrichment, named entity classification, taxonomies and ontologies. Sentiment analysis and security enrichment were less common.
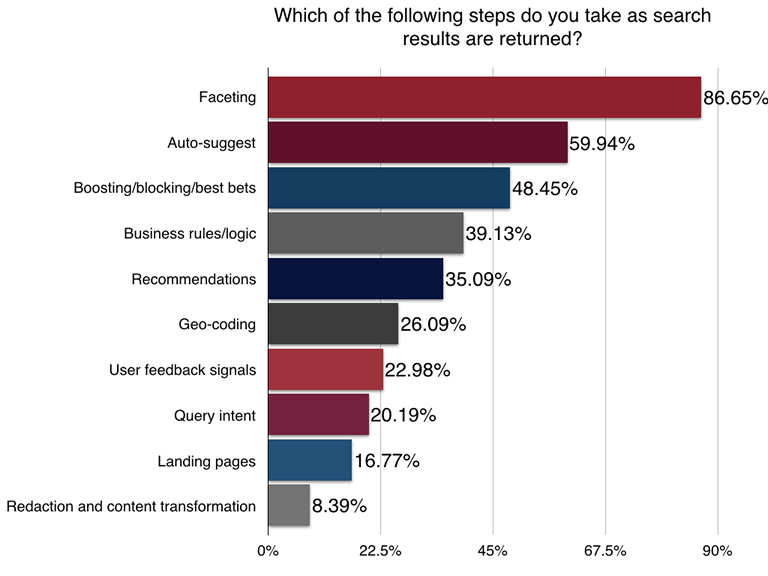
ETL Pipelines and Transformations at Query Time
Transformations can also take place on the query side – as a query is sent by the user to the app and the list of results is returned to the user. Faceting, auto-suggest, and boost/block were in use by nearly half of the applications that developers were working on. User feedback signals continues move up the chain as more search applications start aggregating user behavior to influence search results for an individual user, a particular cohort, or across the entire user base.
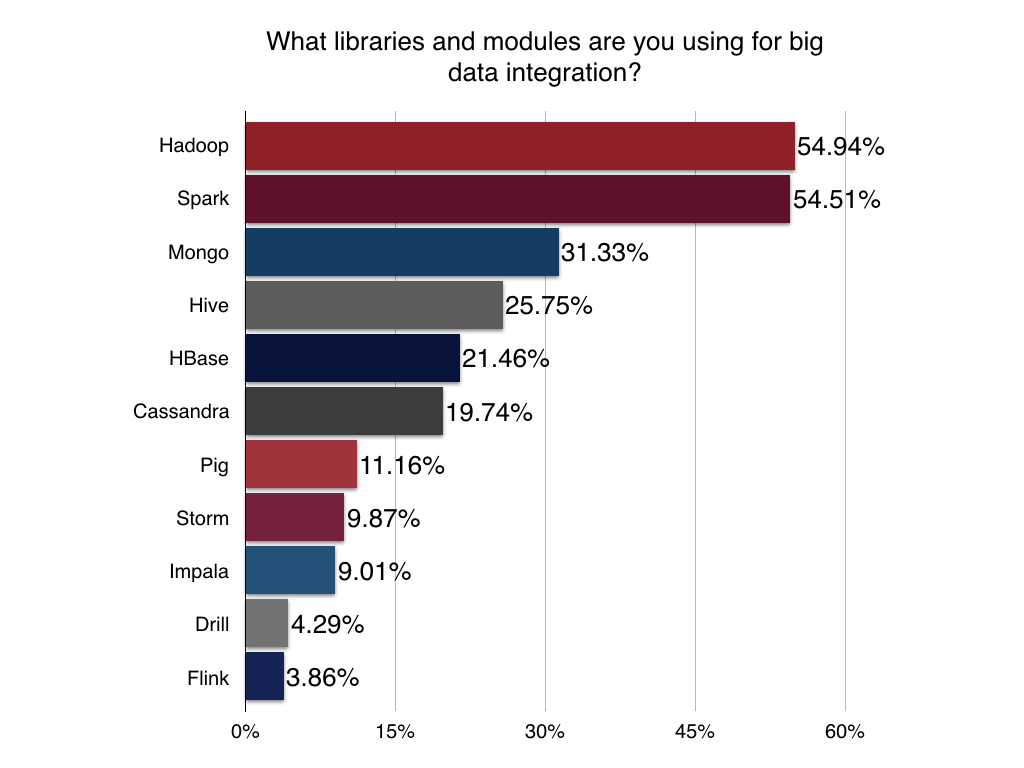
Big Data Integrations
Solr plays well with others so we wanted to get a sense of what big data libraries and modules developers are adding to the mix. Storage and scalability workhorse Hadoop was part of the picture for over half of devs surveyed with Mongo and Spark moving up in the #2 spot from #3 last year. Familiar faces like Cassandra, HBase, Hive, and Pig rounded out the less popular modules.
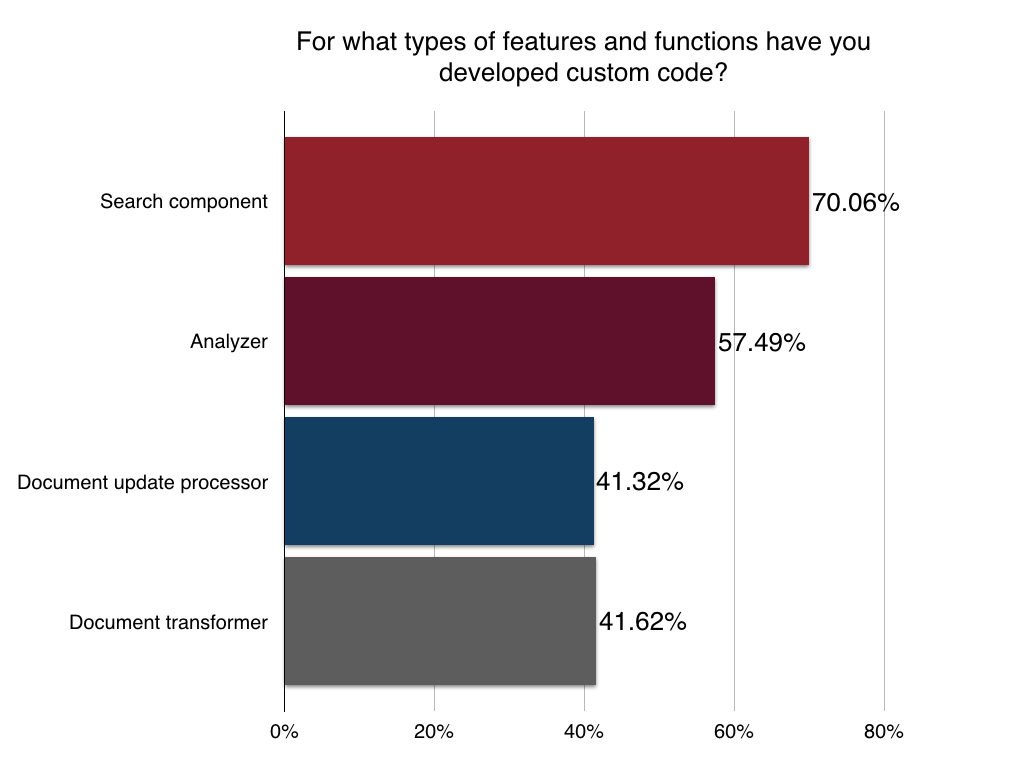
Custom Coding
And finally we wanted to know the kind of blood, sweat, and tears being poured into custom development. When you can’t find a library or the module that you need what do you do?
And that’s the end of our 2016 developer survey.
Thank you to everyone who participated and we’ll see ya in late 2016 to do an update!