Basics of Storing Signals in Solr with Fusion for Data Engineers

In April we featured a guest post Mixed Signals: Using Lucidworks Fusion’s Signals API, which is a great introduction to the Fusion Signals API. In this post I work through a real-world e-commerce dataset to show how quickly the Fusion platform lets you leverage signals derived from search query logs to rapidly and dramatically improve search results over a products catalog.
Signals, What’re They Good For?
In general, signals are useful any time information about outside activity, such as user behavior, can be used to improve the quality of search results. Signals are particularly useful in e-commerce applications, where they can be used to make recommendations as well as to improve search. Signal data comes from server logs and transaction databases which record items that users search for, view, click on, like, or purchase. For example, clickstream data which records a user’s search query together with the item which was ultimately clicked on is treated as one “click” signal and can be used to:</p
- enrich the results set for that search query, i.e., improve the items returned for that query
- enrich the information about the item clicked on, i.e., improve the queries for that item
- uncover similarities between items, i.e., cluster items based on other clicks on for queries
- make recommendations of the form:
- “other customers who entered this query clicked on that”
- “customers who bought this also bought that”
Signals Key Concepts
- A signal is a piece of information, event, or action, e.g., user queries, clicks, and other recorded actions that can be related back to a document or documents which are stored in a Fusion collection, referred to as the “primary collection”.
- A signal has a type, an id, and a timestamp. For example, signals from clickstream information are of type “click” and signals derived from query logs are of type “query”.
- Signals are stored in an auxiliary collection and naming conventions link the two so that the name of the signals collection is the name the primary collection plus the suffix “_signals”.
- An aggregation is the result of processing a stream of signals into a set of summaries that can be used to improve the search experience. Aggregation is necessary because in the usual case there is a high volume of signals flowing into the system but each signal contains only a small amount of information in and of itself.
- Aggregations are stored in an auxiliary collection and naming conventions link the two so that the name of the aggregations collection is the name the primary collection plus the suffix “_signals_aggr”.
- Query pipelines use aggregated signals to boost search results.
- Fusion provides an extensive library of aggregation functions allowing for complex models of user behavior. In particular, date-time functions provide a temporal decay function so that over time, older signals are automatically downweighted.
- Fusion’s job scheduler provides the mechanism for processing signals and aggregations collections in near real-time.
Some Assembly Required
In a canonical e-commerce application, your primary Fusion collection is the collection over your products, services, customers, and similar. Event information from transaction databases and server logs would be indexed into an auxiliary collection of raw signal data and subsequently processed into an aggregated signals collection. Information from the aggregated signals collection would be used to improve search over the primary collection and make product recommendations to users.
In the absence of a fully operational ecommerce website, the Fusion distribution includes an example of signals and a script that processes this signal data into an aggregated signals collection using the Fusion Signals REST-API. The script and data files are in the directory $FUSION/examples/signals (where $FUSION is the top-level directory of the Fusion distribution). This directory contains:
signals.json– a sample data set of 20,000 signal events. These are ‘click’ events.signals.sh– a script that loads signals, runs one aggregation job, and gets recommendations from the aggregated signals.aggregations_definition.json– examples of how to write custom aggregation functions. These examples demonstrate several different advanced features of aggregation scripting, all of which are outside of the scope of this introduction.
The example signals data comes from a synthetic dataset over Best Buy query logs from 2011. Each record contains the user search query, the categories searched, and the item ultimately clicked on. In the next sections I create the product catalog, the raw signals, and the aggregated signals collections.
Product Data: the primary collection ‘bb_catalog’
In order to put the use of signals in context, first I recreate a subset of the Best Buy product catalog. Lucidworks cannot distribute the Best Buy product catalog data that is referenced by the example signals data, but that data is available from the Best Buy Developer API, which is a great resource both for data and example apps. I have a copy of previously downloaded product data which has been processed into a single file containing a list of products. Each product is a separate JSON object with many attribute-value pairs. To create your own Best Buy product catalog dataset, you must register as a developer via the above URL. Then you can use the Best Buy Developer API query tool to select product records or you can download a set of JSON files over the complete product archives.
I create a data collection called “bb_catalog” using the Fusion 2.0 UI. By default, this creates collections for the signals and aggregated signals as well.
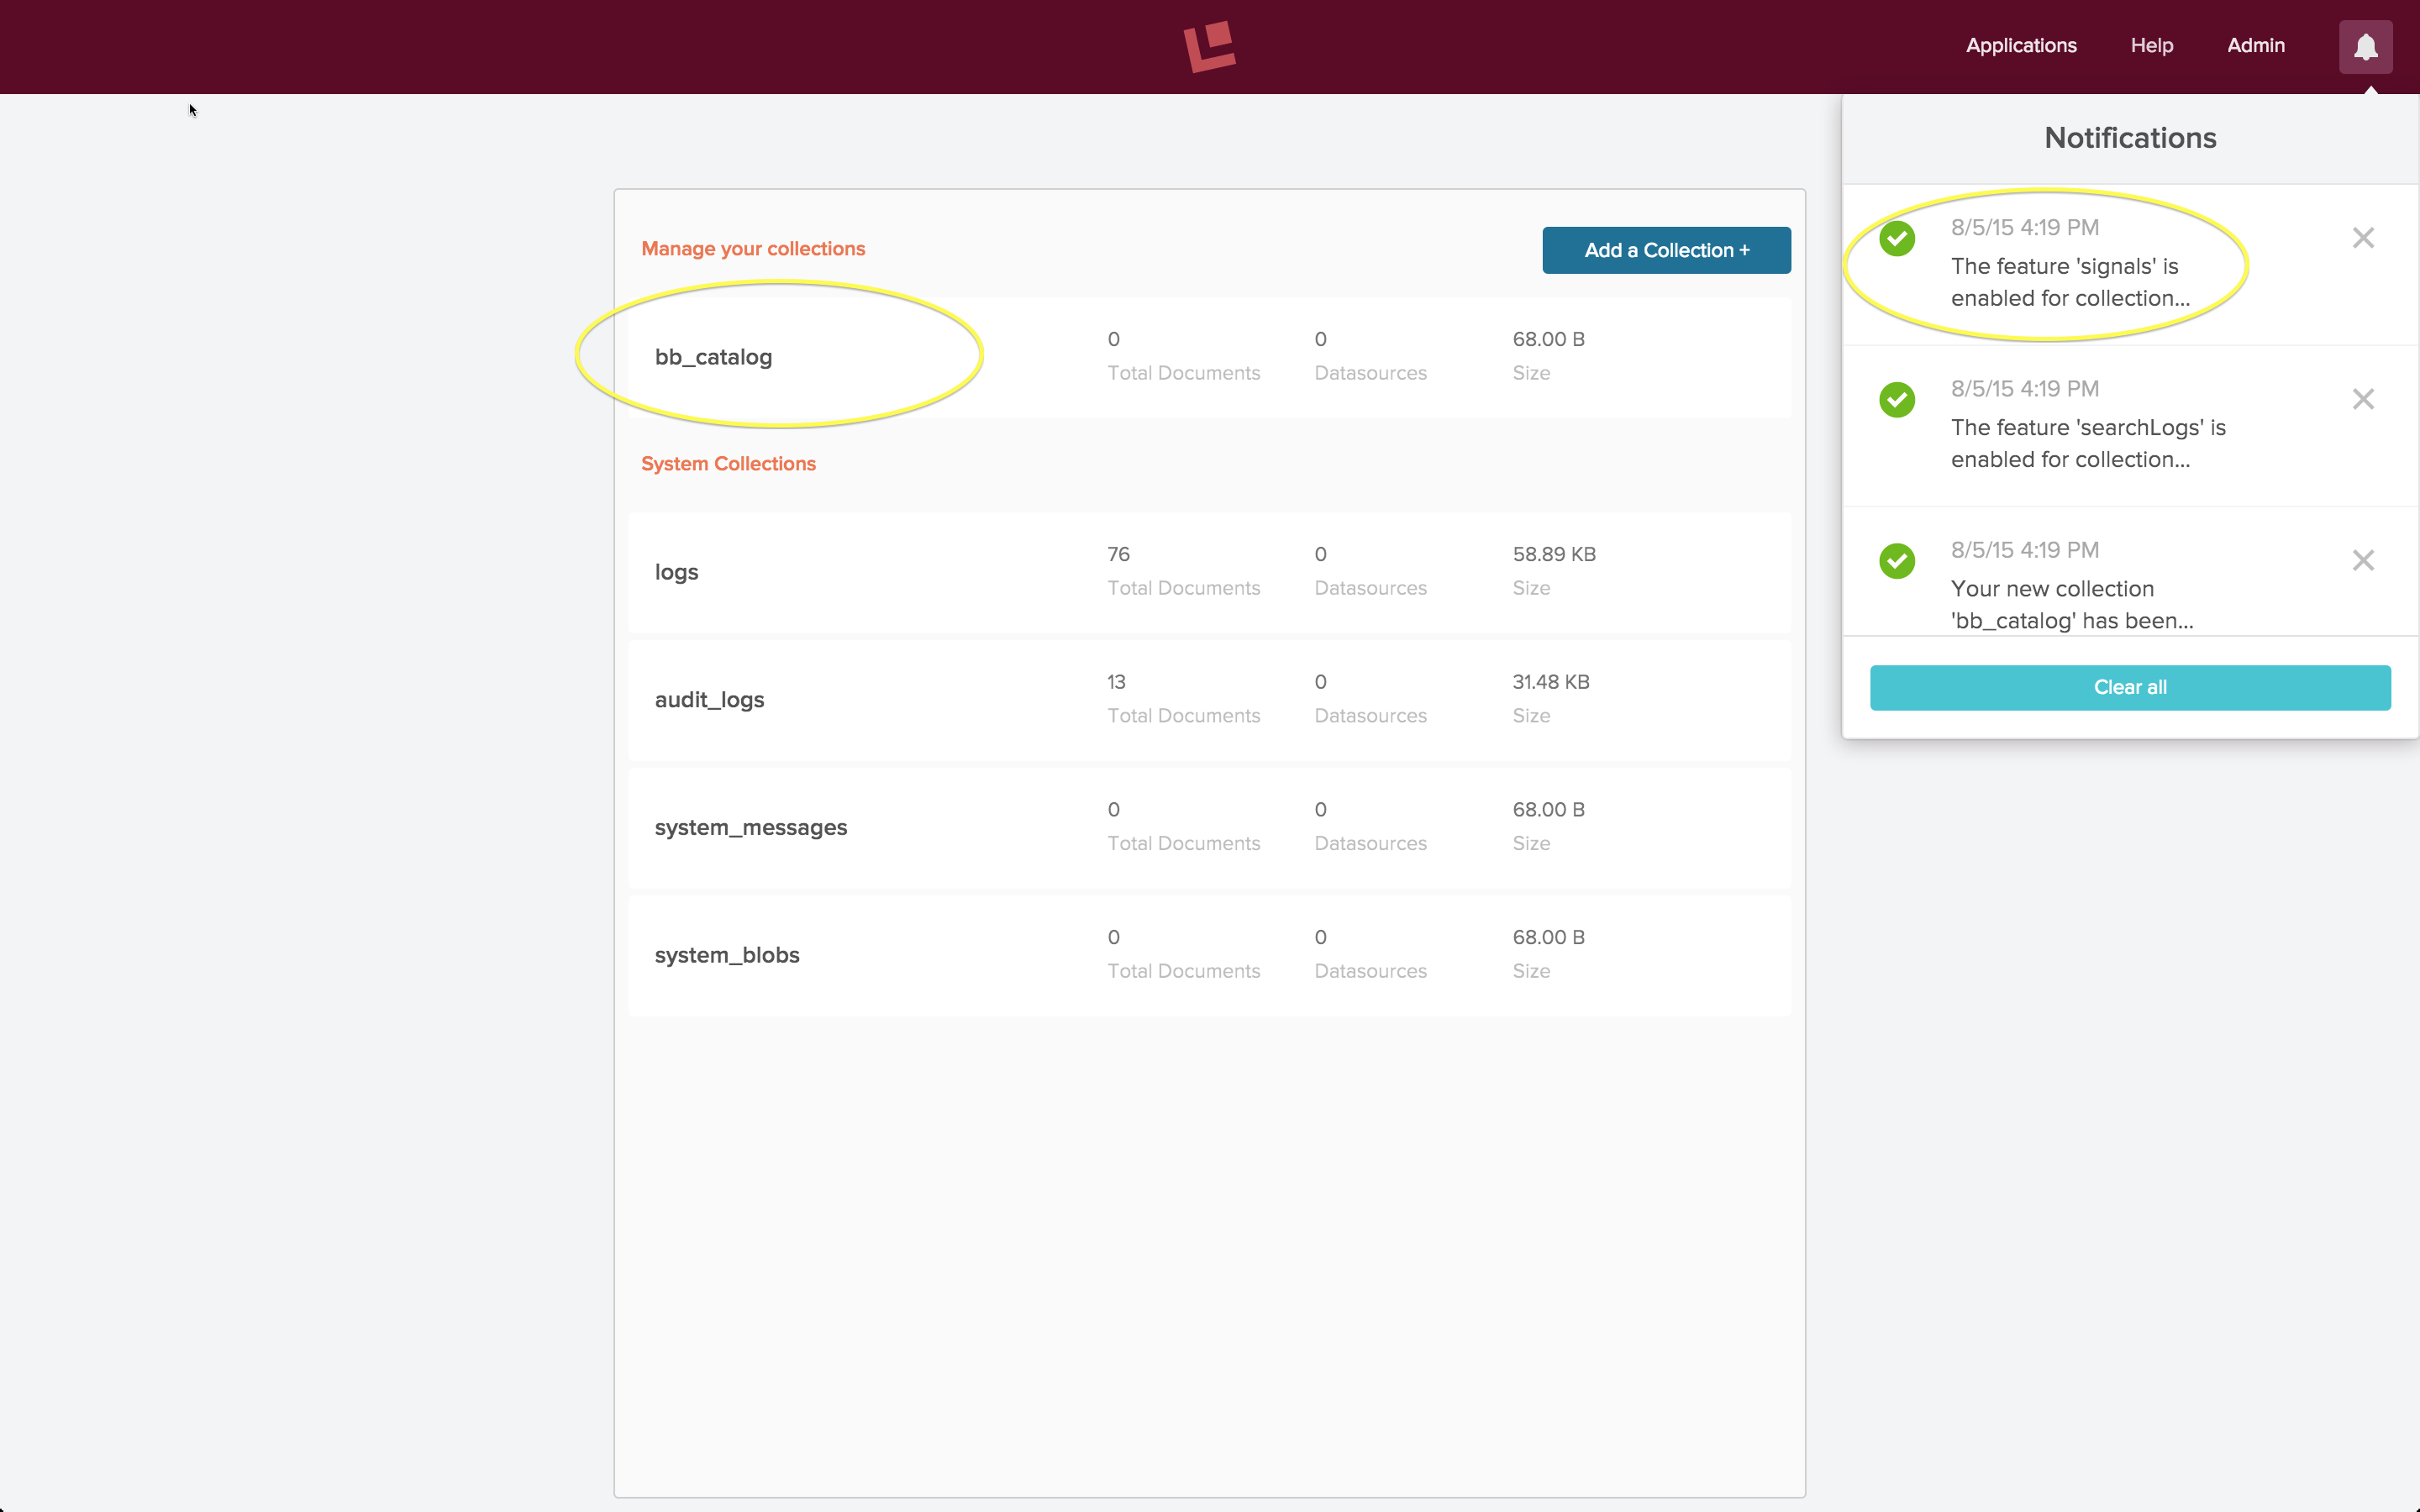
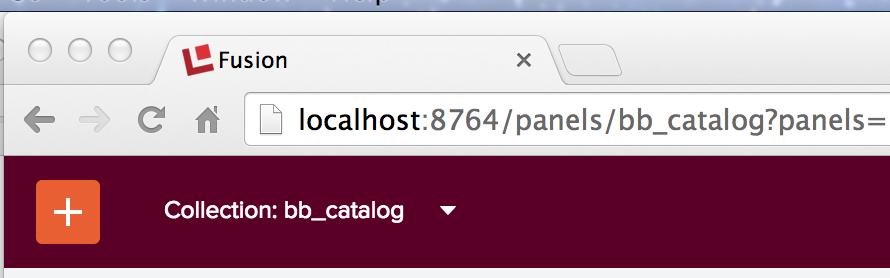
Although the collections panel only lists collection “bb_catalog”, collections “bb_catalog_signals” and “bb_catalog_signals_aggr” have been created as well. Note that when I’m viewing collection “bb_catalog”, the URL displayed in the browser is: “localhost:8764/panels/bb_catalog”:
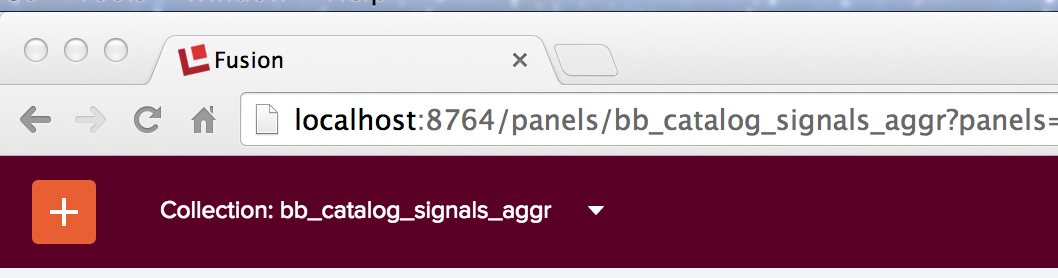
By changing the collection name to “bb_catalog_signals” or “bb_catalog_signals_aggr”, I can view the (empty) contents of the auxiliary collections:
Next I index the Best Buy product catalog data into collection “bb_catalog”. If you choose to get the data in JSON format, you can ingest it into Fusion using the “JSON” indexing pipeline. See blog post Preliminary Data Analysis in Fusion 2 for more details on configuring and running datasources in Fusion 2.
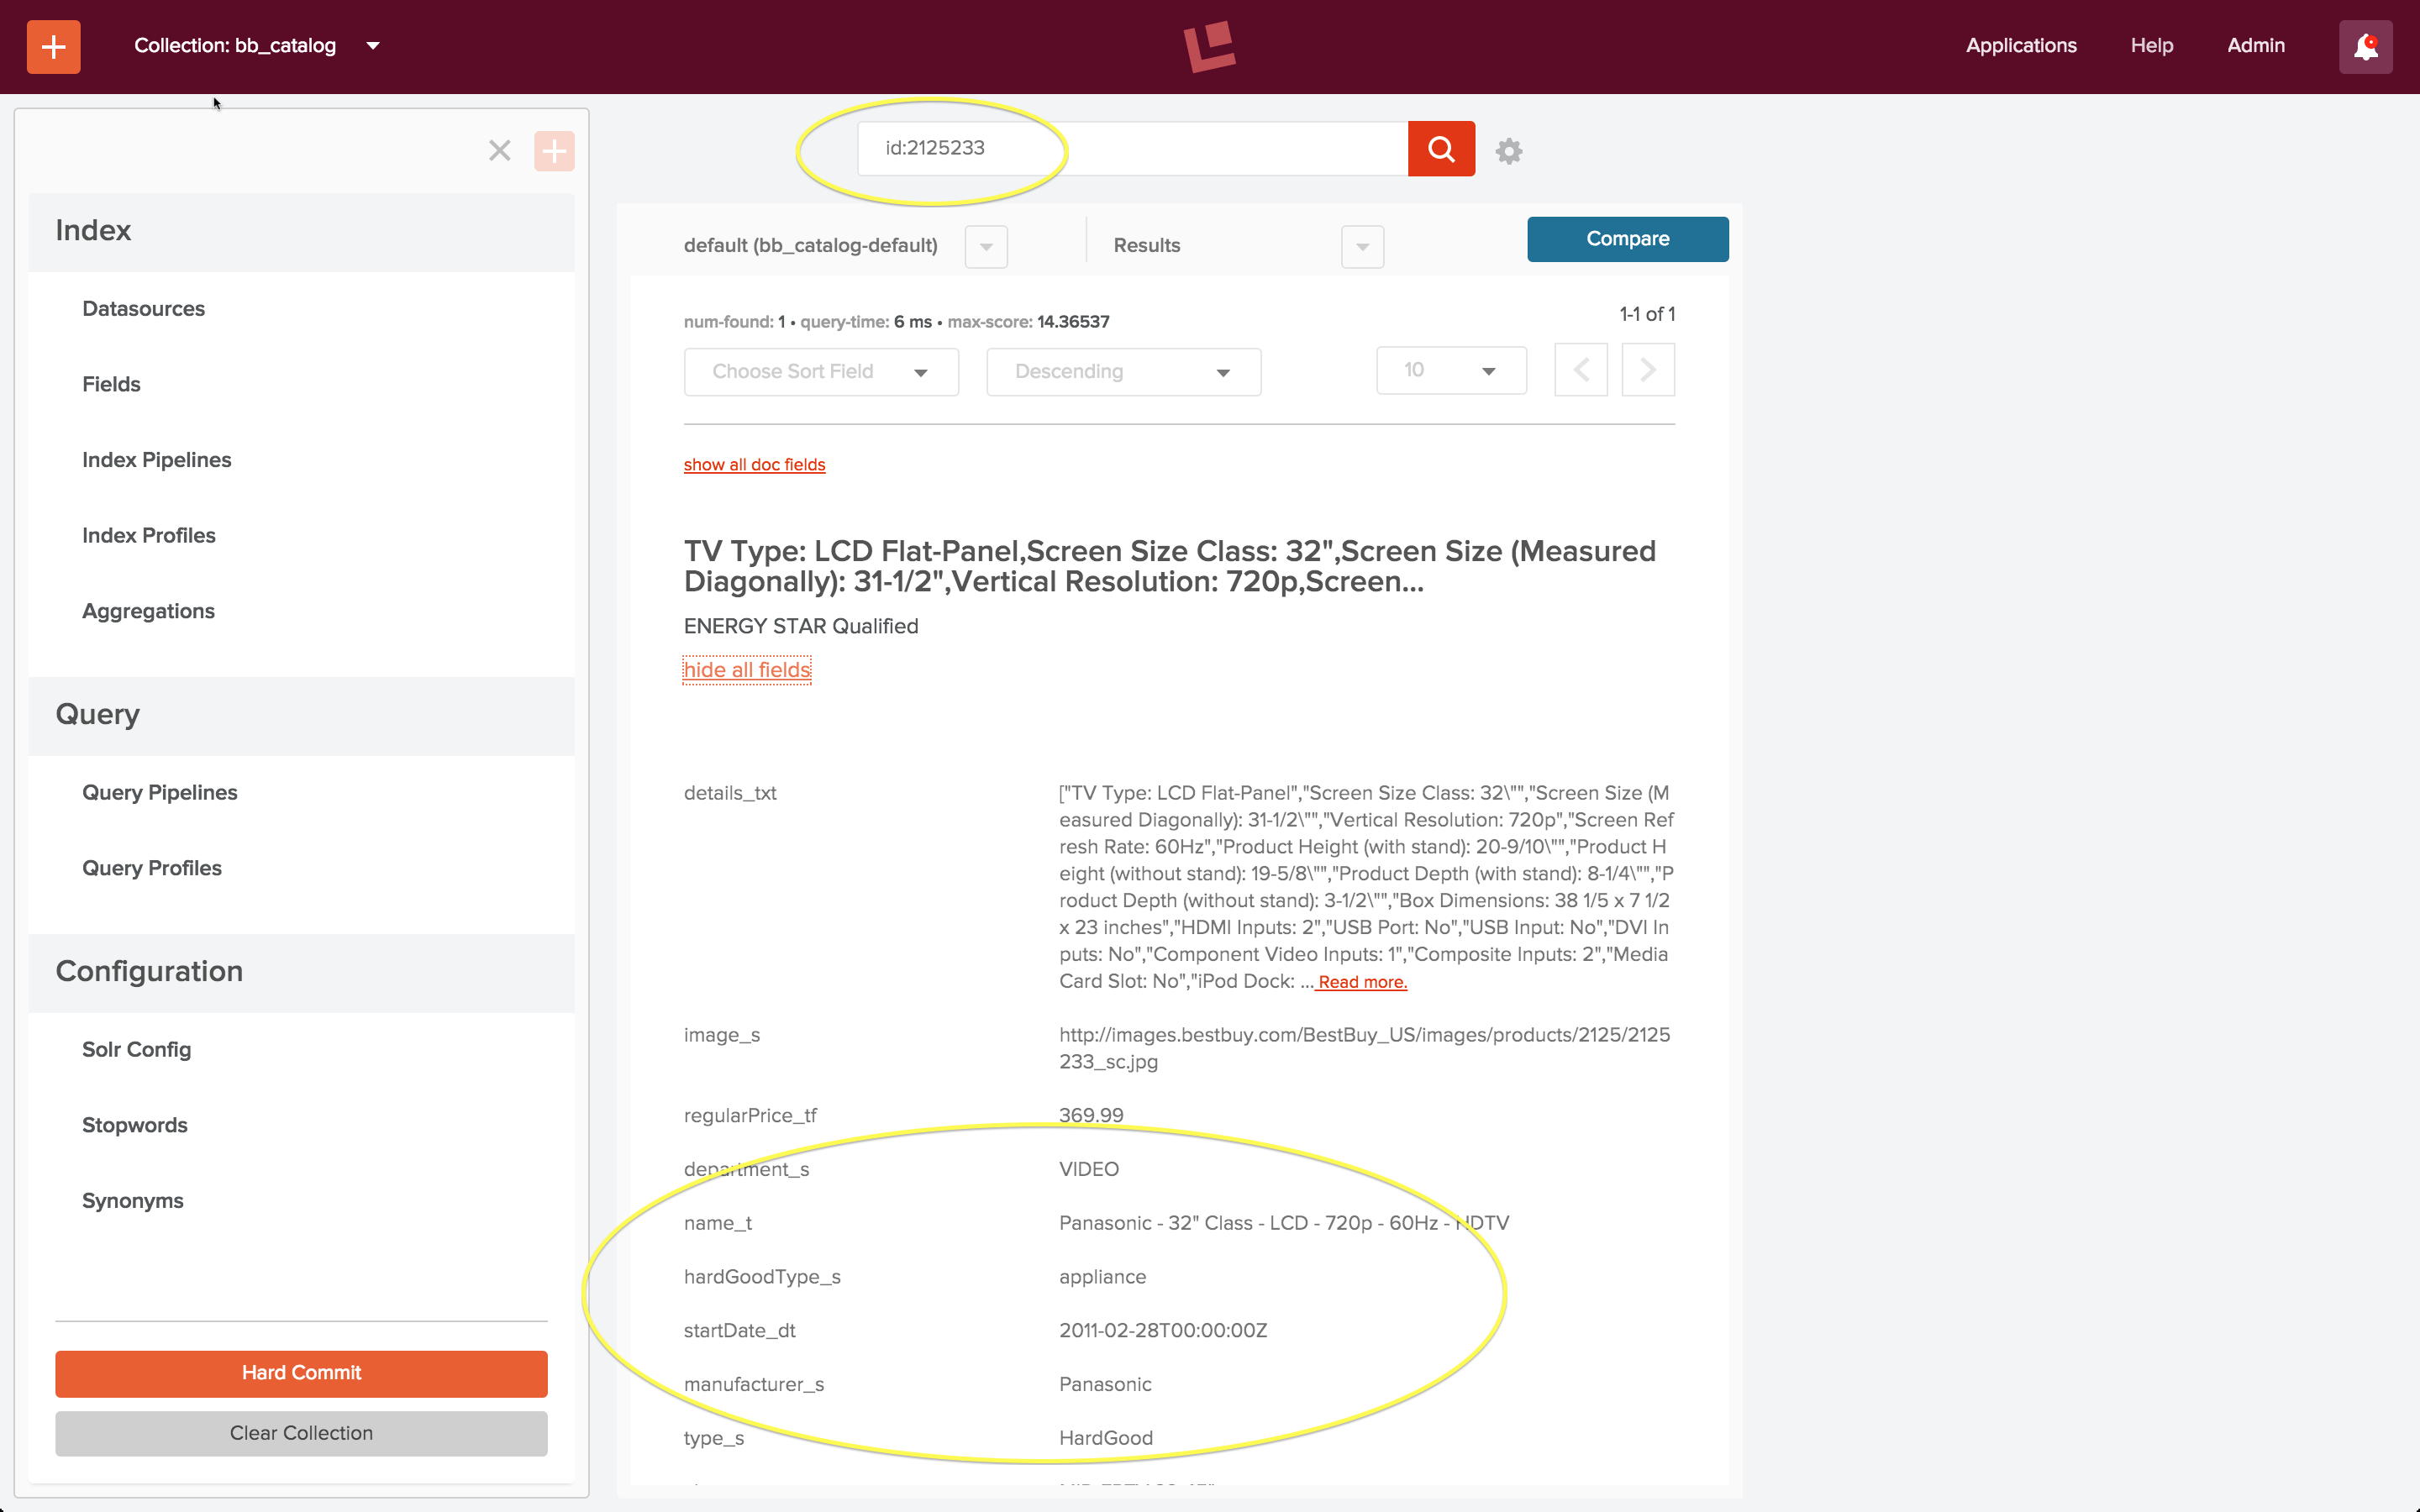
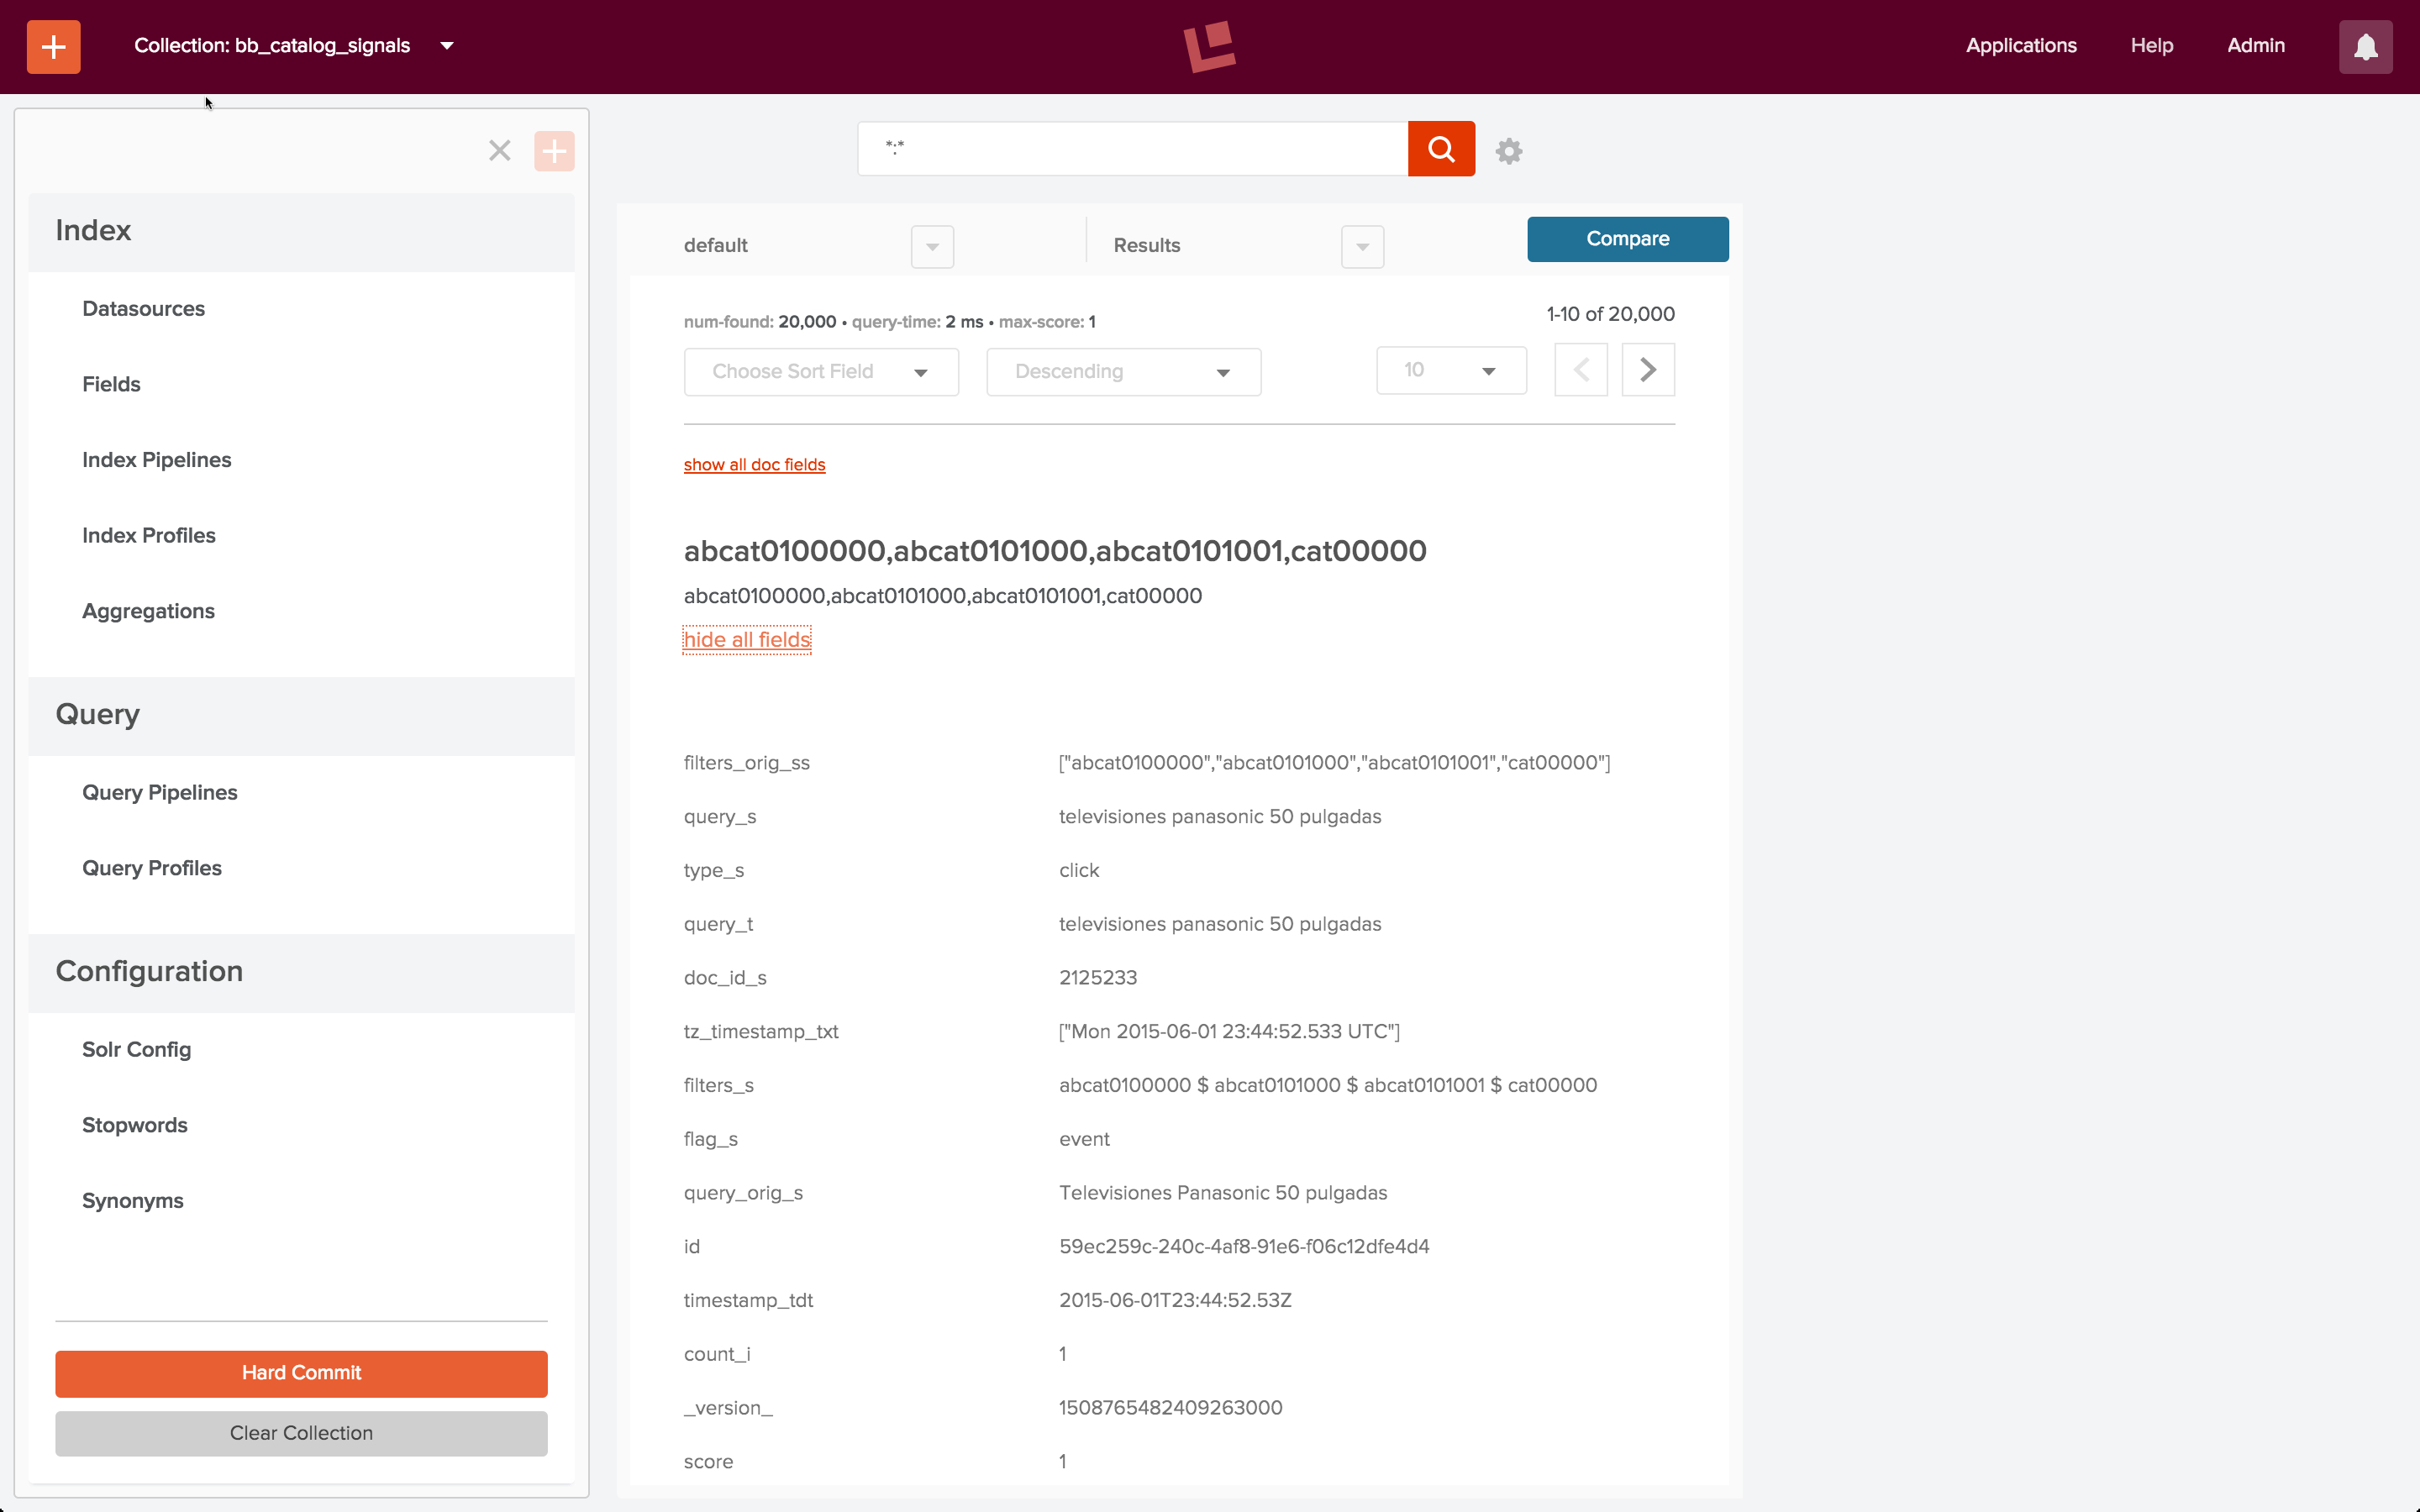
After loading the product catalog dataset, I check to see that collection “bb_catalog” contains the products referenced by the signals data. The first entry in the example signals file “signals.json”is a search query with query text: “Televisiones Panasonic 50 pulgadas” and docId: “2125233”. I do a quick search to find a product with this id in collection “bb_catalog”, and the results are as expected:
Raw Signal Data: the auxiliary collection ‘bb_catalog_signals’
The raw signals data in the file “signals.json” are the synthetic Best Buy dataset. I’ve modified the timestamps on the search logs in order to make them seem like fresh log data. This is the first signal (timestamp updated):
{
    "timestamp": "2015-06-01T23:44:52.533Z",
    "params": {
      "query": "Televisiones Panasonic  50 pulgadas",
      "docId": "2125233",
      "filterQueries": [
        "cat00000",
        "abcat0100000",
        "abcat0101000",
        "abcat0101001"
      ]
    },
    "type": "click"
  },
The top-level attributes of this object are:
- type – As stated above, all signals must have a “type”, and as noted in the earlier post “Mixed Signals”, section “Sending Signals”, the value should be applied consistently to ensure accurate aggregation. In the example dataset, all signals are of type “click”.
- timestamp – This data has timestamp information. If not present in the raw signal, it will be generated by the system.
- id – These signals don’t have distinct ids; they will be generated automatically by the system.
- params – This attribute contains a set of key-value pairs, using a set of pre-defined keys which a appropriate for search-query event information. In this dataset, the information captured includes the free-text search query entered by the user, the document id of the item clicked on, and the set of Best Buy site categories that the search was restricted to. These are codes for categories and sub-categories such as “Electronics” or “Televisions”.
In summary, this dataset is an unremarkable snapshot of user behaviors between the middle of August and the end of October, 2011 (updated to May through June 2015).
The example script “signals.sh” loads the raw signal via a POST request to the Fusion REST-API endpoint:
/api/apollo/signals/<collectionName>
where <collectionName> is the name of the primary collection itself. Thus, to load raw signal data into the Fusion collection “bb_catalog_signals”, I send a POST request to the endpoint:
/api/apollo/signals/bb_catalog
Like all indexing processes, an indexing pipeline is used to process the raw signal data into a set of Solr documents. The pipeline used here is the default signals indexing pipeline named “_signals_ingest”. This pipeline consists of three stages, the first of which is a Signal Formatter stage, followed by a Field Mapper stage, and finally a Solr Indexer stage.
(Note that in a production system, instead of doing a one time upload of some server log data, raw signal data could be streamed into a signals collection an ongoing basis by using a Logstash or JDBC connector together with a signals indexing pipeline. For details on using a Logstash connector, see blog post on Fusion with Logstash).
Here is the curl command I used, running Fusion locally in single server mode on the default port:
curl -u admin:password123 -X POST -H 'Content-type:application/json' http://localhost:8764/api/apollo/signals/bb_catalog?commit=true --data-binary @new_signals.json
This command succeeds silently. To check my work, I use the Fusion 2 UI to view the signals collection, by explicitly specifying the URL “localhost:8764/panels/bb_catalog_signals”. This shows that all 20K signals have been indexed:
Further exploration of the data can be done using Fusion dashboards. To configure a Fusion dashboard using Banana 3, I specify the URL “localhost:8764/banana”. (For details and instructions on Banana 3 dashboards, see this this post on log analytics). I configure a signals dashboard and view the results:
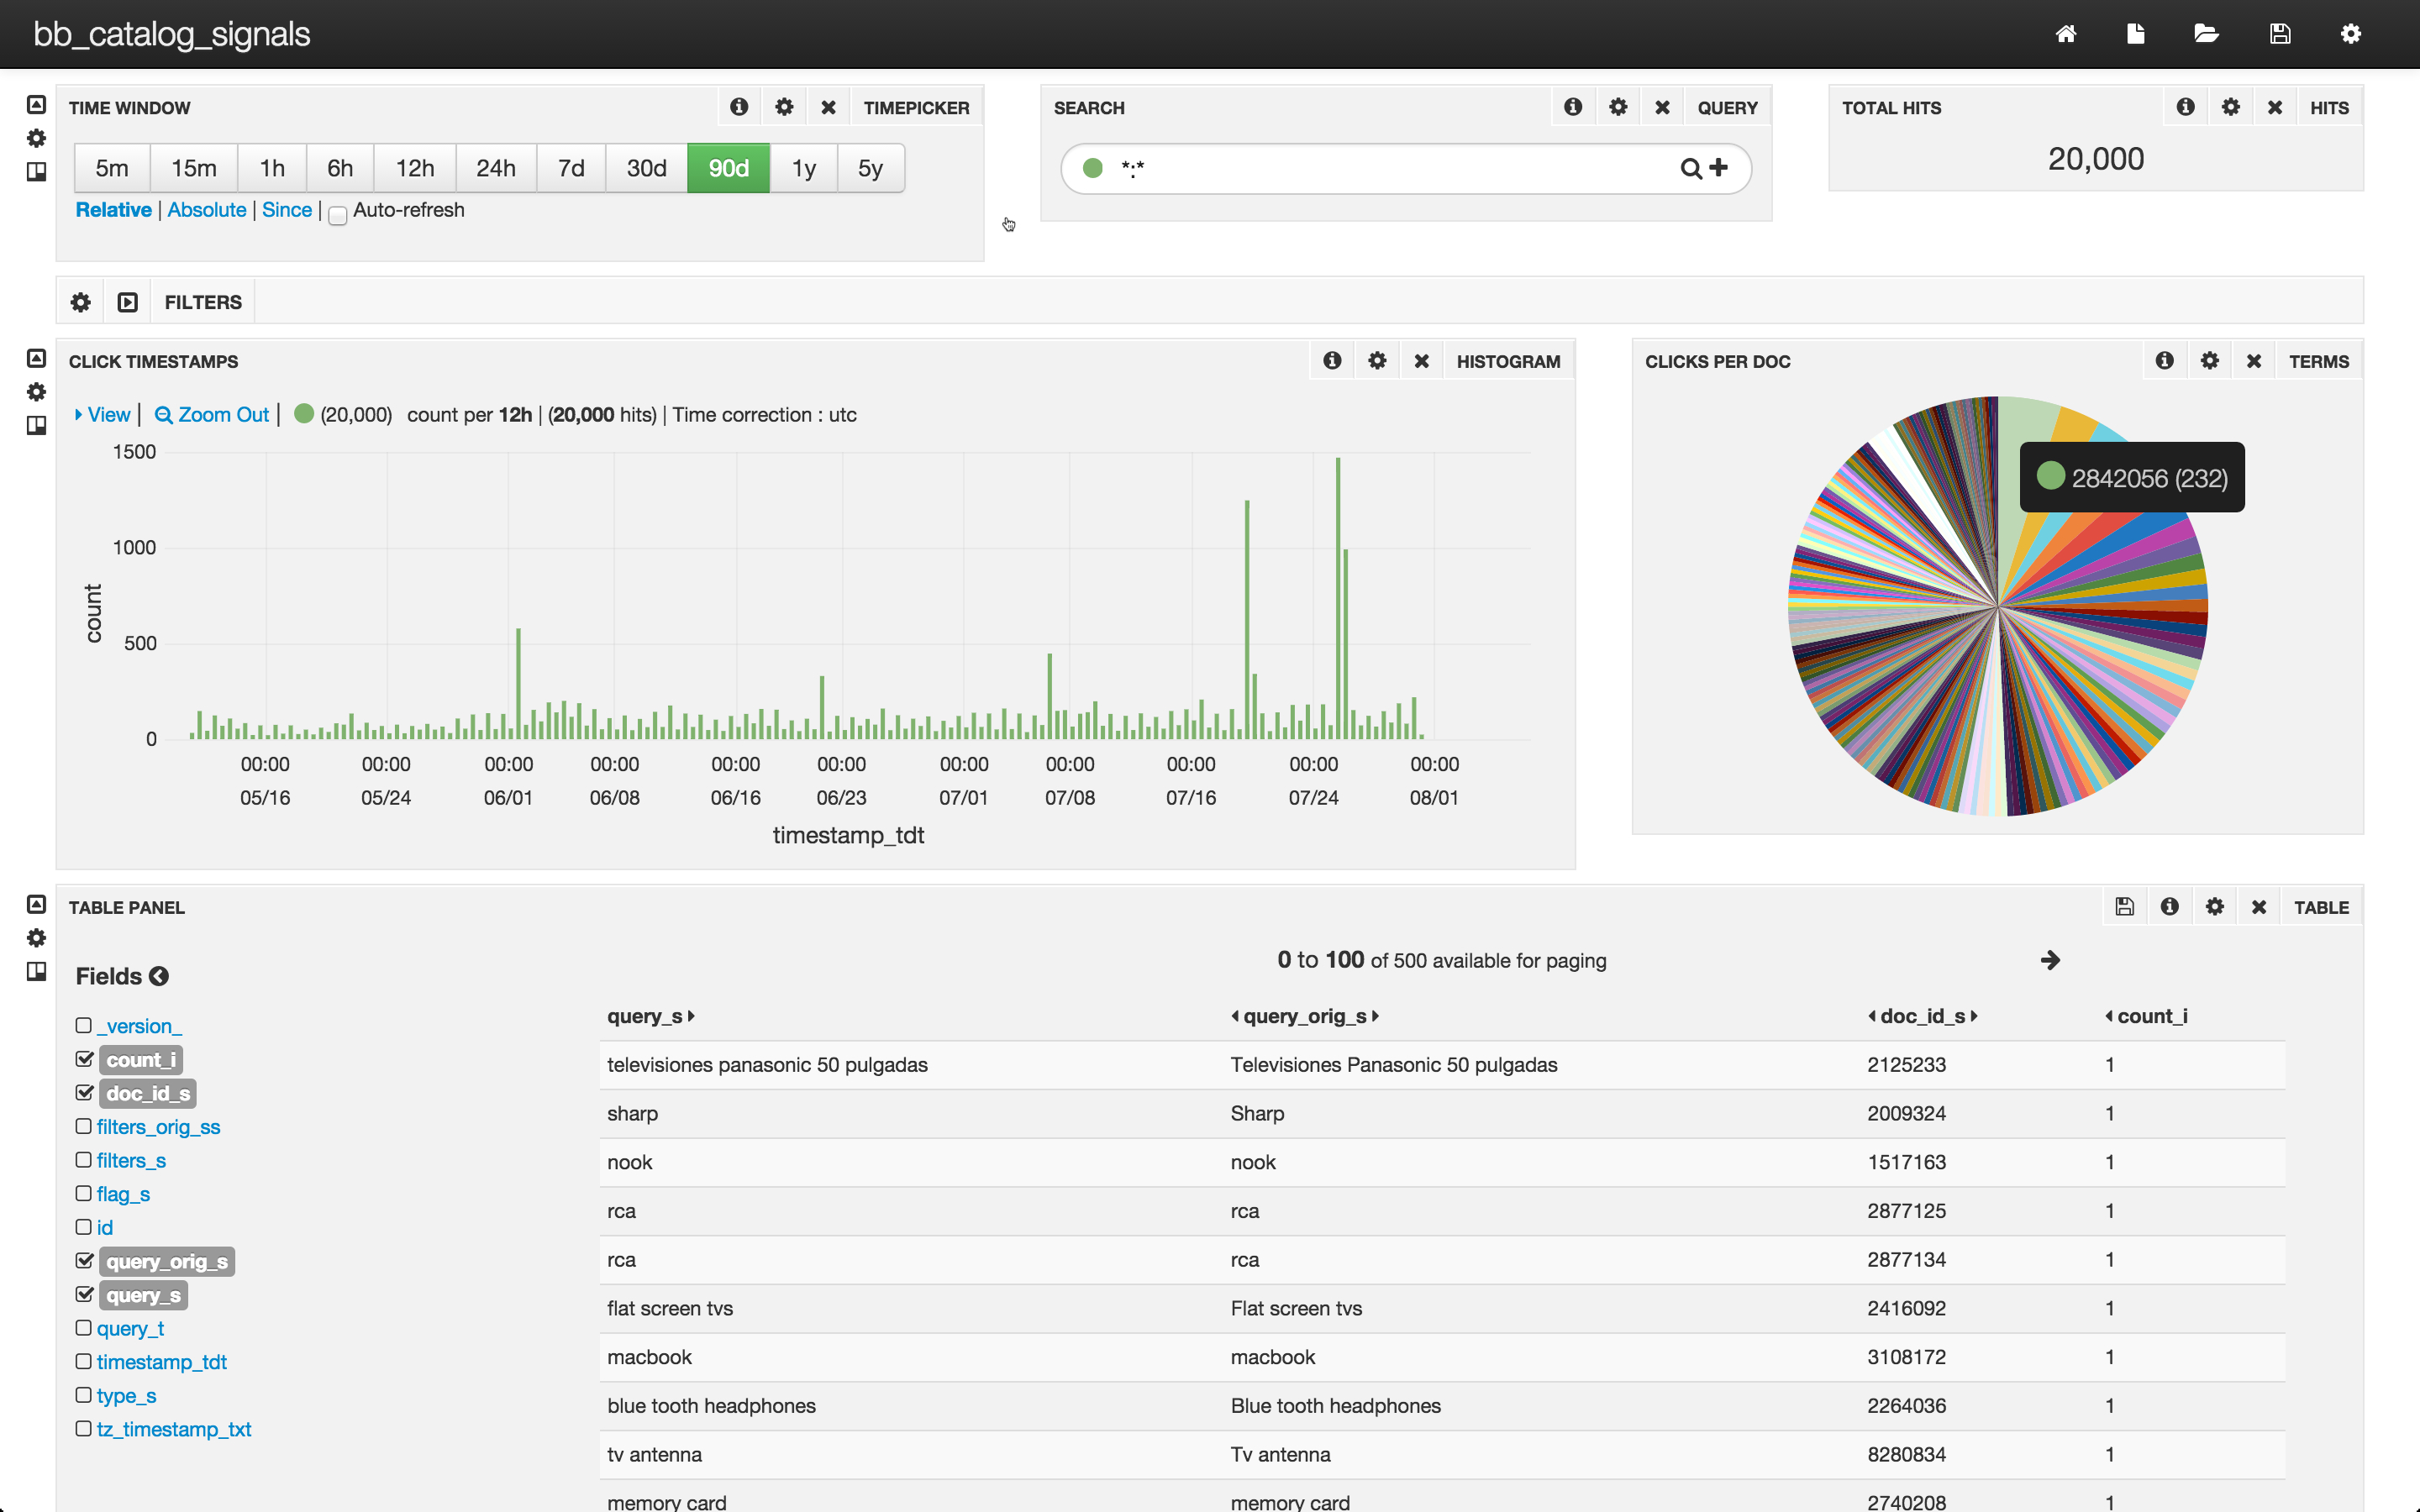
The top row of this dashboard shows that there are 20,000 clicks in the collection bb_catalog_signals that were recorded in the last 90 days. The middle row contains a bar-chart showing the time at which the clicks came in and a pie chart display of top 200 documents that were clicked on. The bottom row is a table over all of the signals – each signal contains only click.
The pie chart allows us to visualize a simple aggregation of clicks per document. The most popular document got 232 clicks, roughly 1% of the total clicks. The 200th most popular document got 12 clicks, and the vast majority of documents only got one click per document. In order to use information about documents clicked on, we need to make this information available in a form that Solr can use. In other words, we need to create a collection of aggregated signals.
Aggregated Signals Data: the auxiliary collection ‘bb_catalog_signals_aggr’
Aggregation is the “processing” part of signals processing. Fusion runs queries over the documents in the raw signals collection in order to synthesize new documents for the aggregated signals collection. Synthesis ranges from counts to sophisticated statistical functions. The nature of the signals collected determines the kinds of aggregations performed. For click signals from query logs, the processing is straightforward: an aggregated signal record contains a search query, a count of the number of raw signals that contained that search query; and aggregated information from all raw signals: timestamps, ids of documents clicked on, search query settings, in this case, the product catalog categories over which that search was carried out.
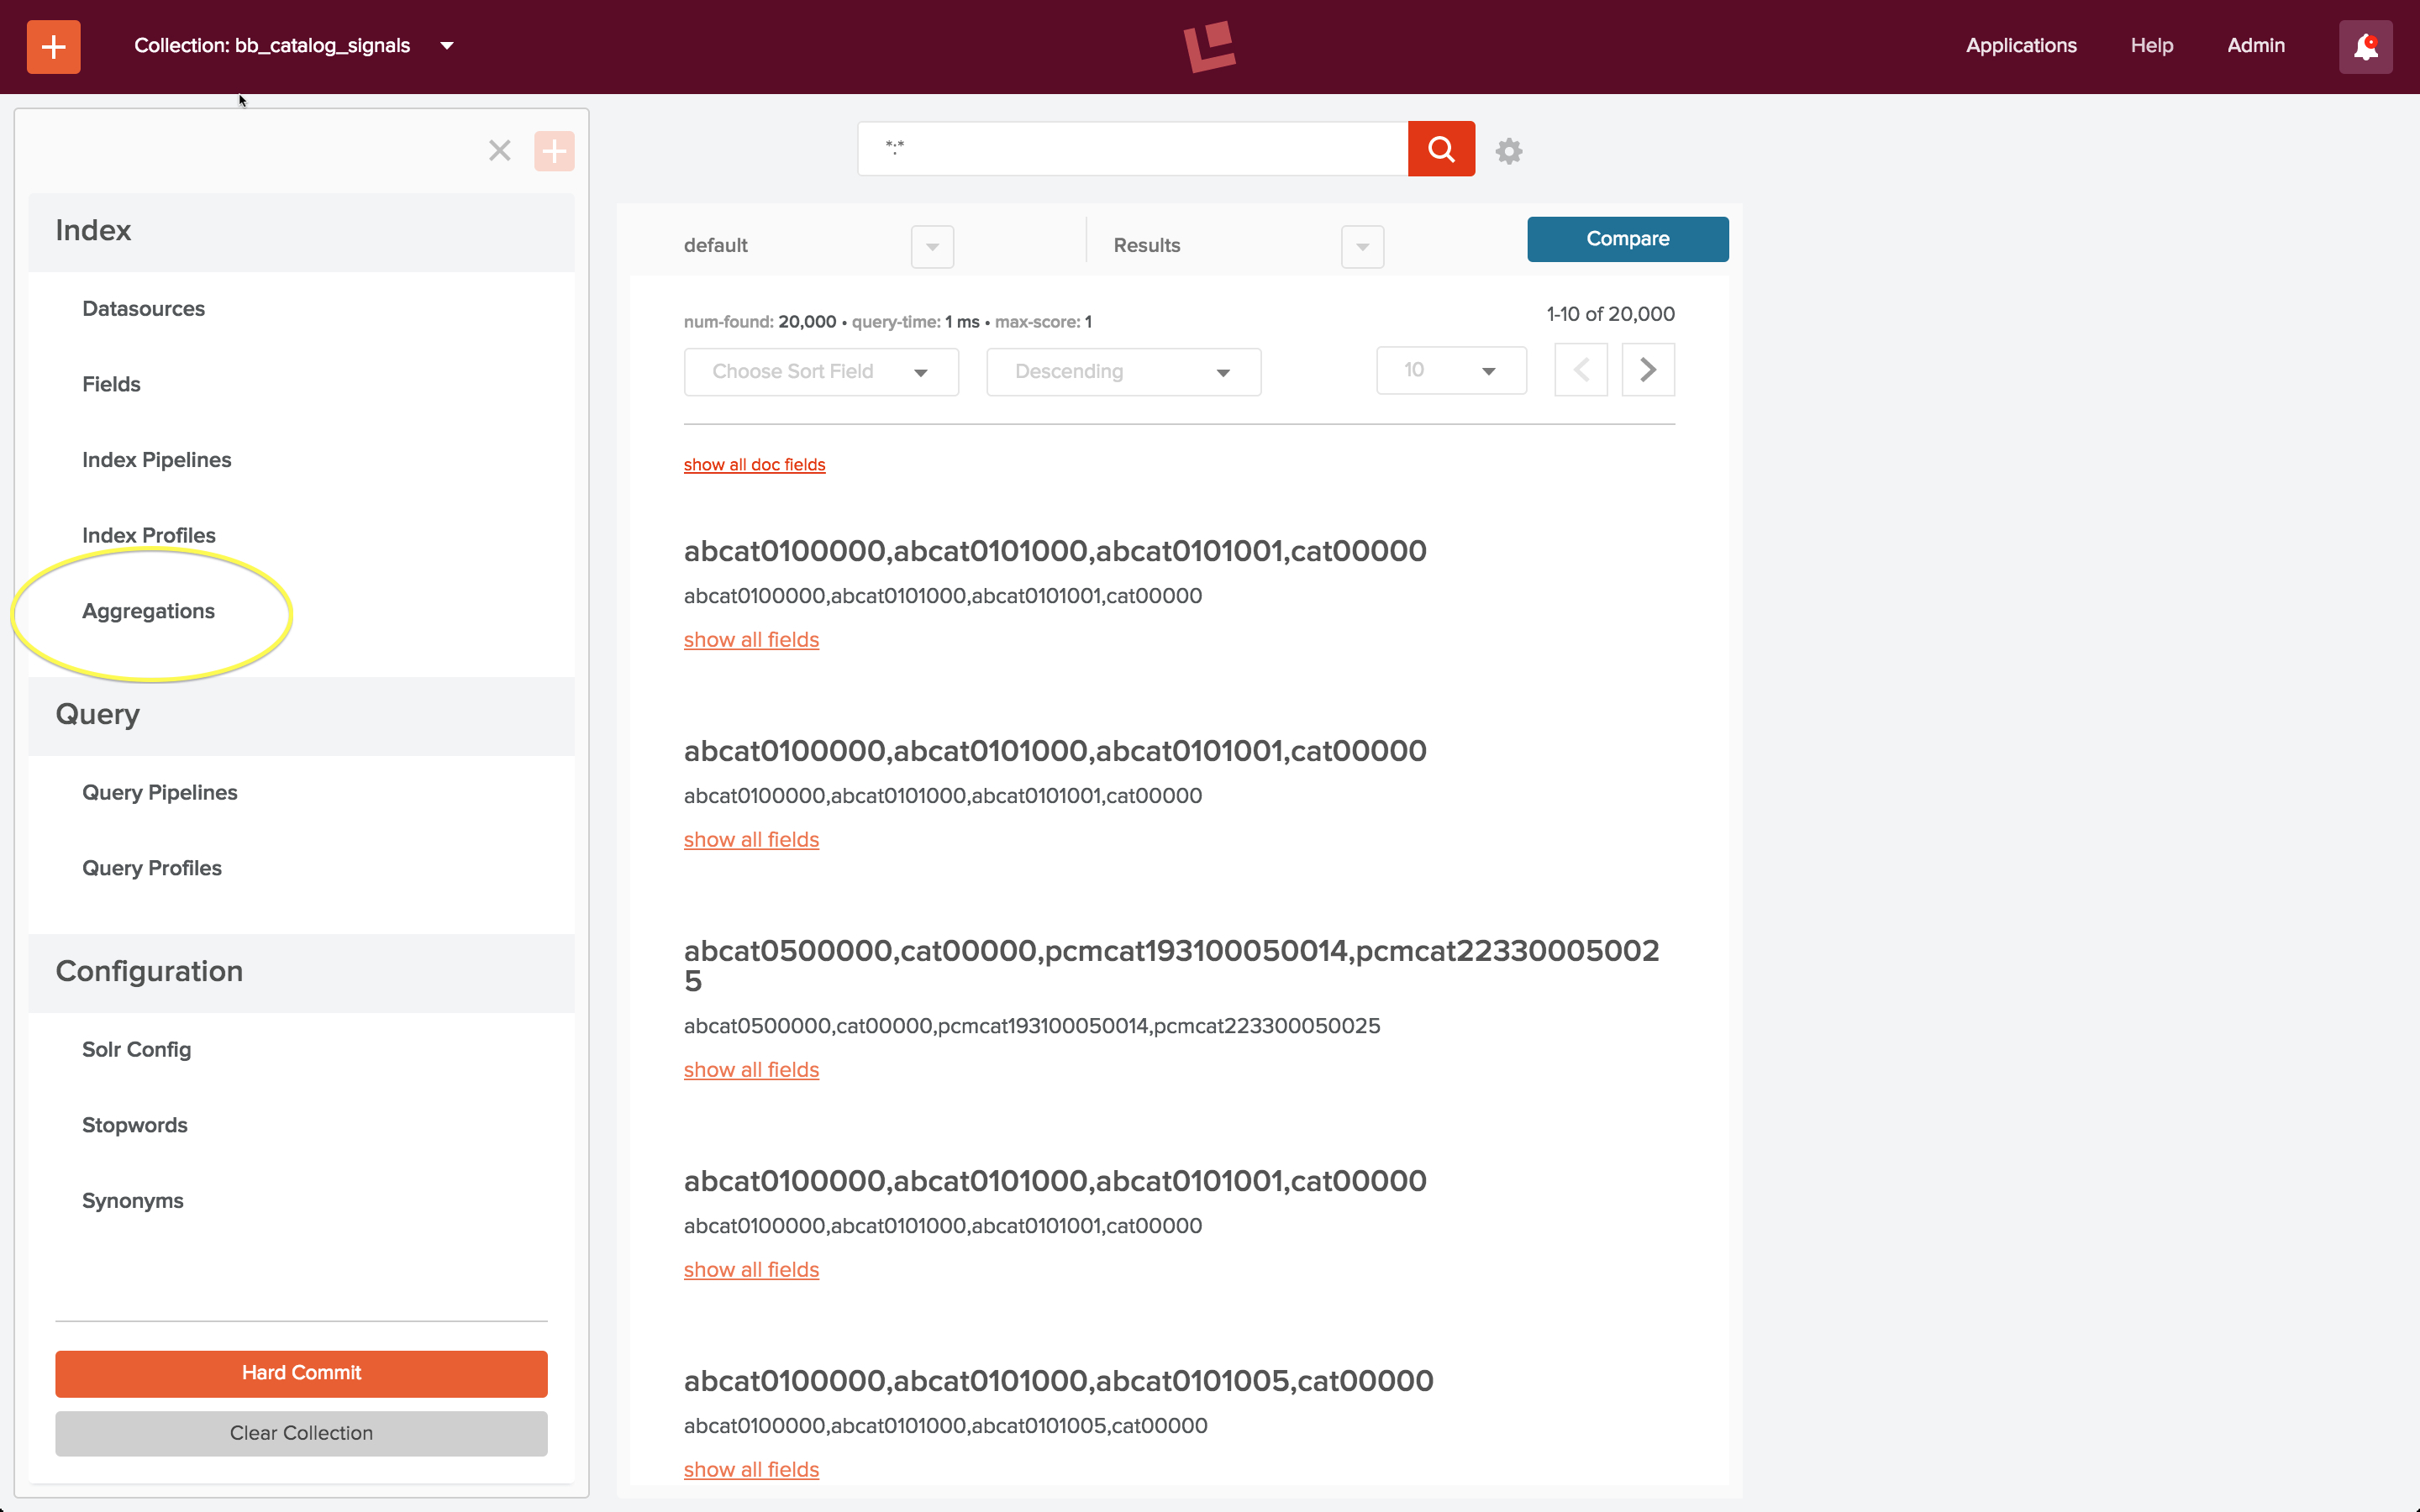
To aggregate the raw signals in collection “bb_catalog_signals” from the Fusion 2 UI, I choose the “Aggregations” control listed in the “Index” section of the “bb_catalog_signals” home panel:
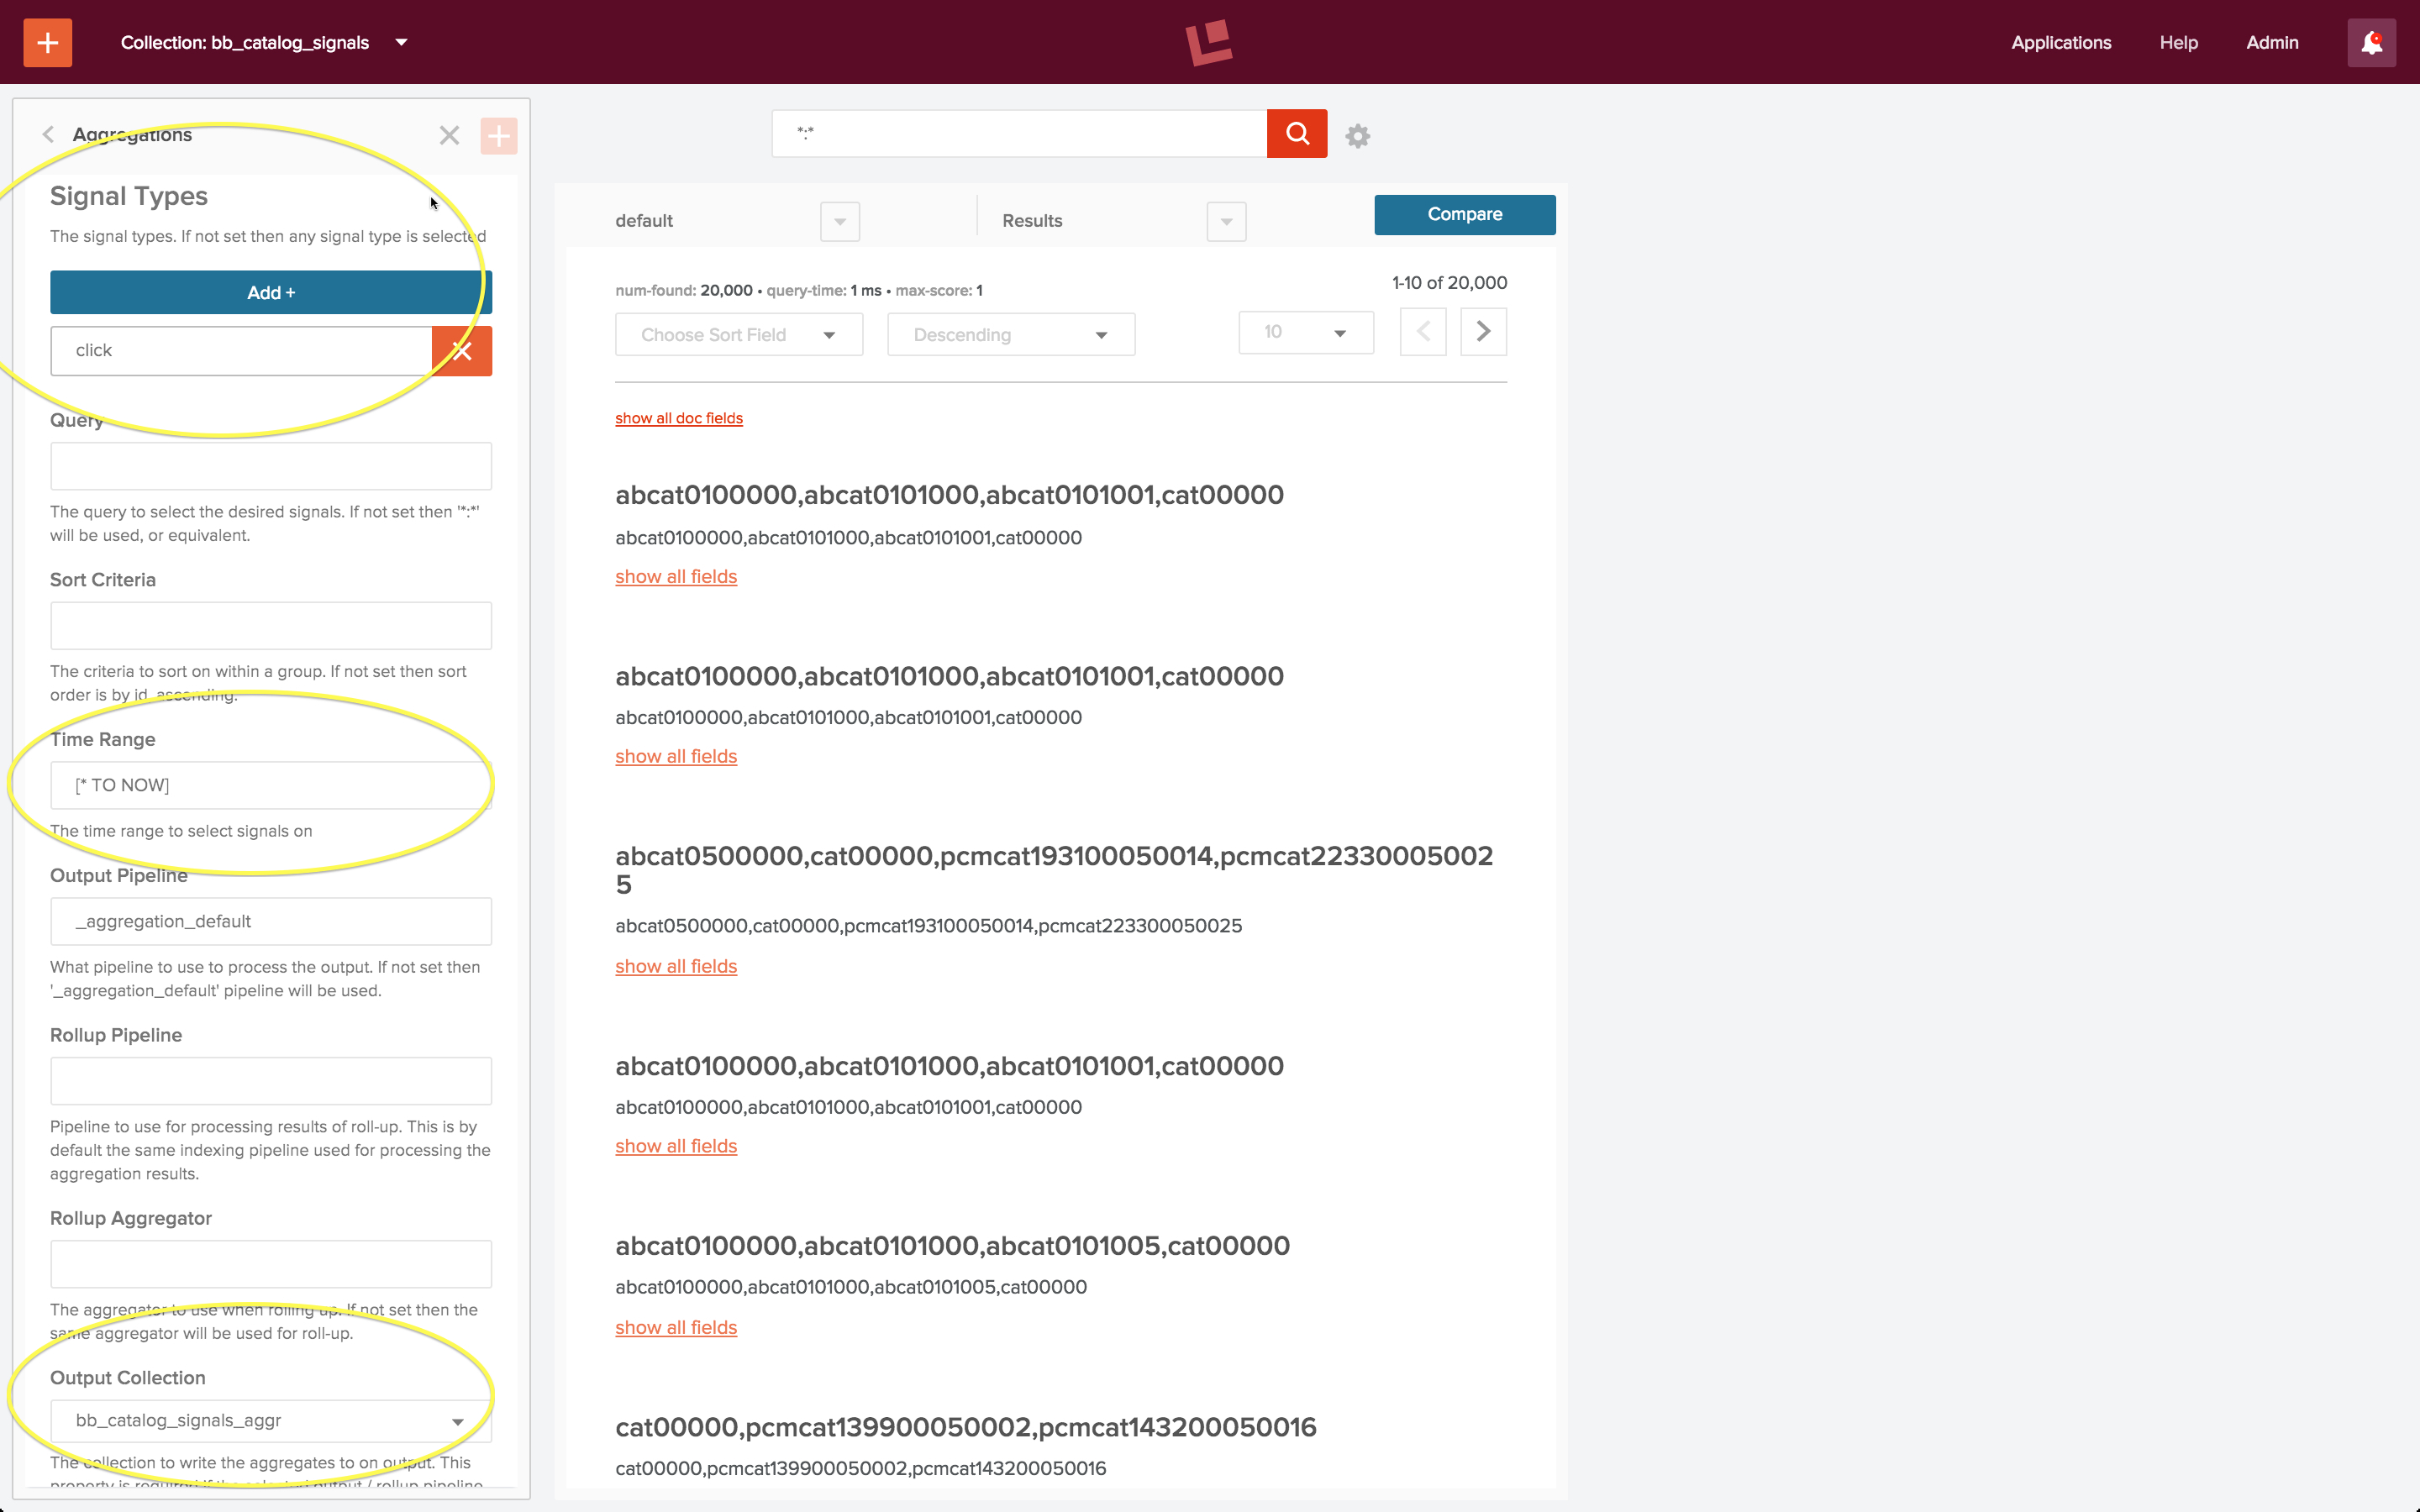
I create a new aggregation called “bb_aggregation” and define the following:
- Signal Types = “click”
- Time Range = “[* TO NOW]” (all signals)
- Output Collection = “bb_catalog_signals_aggr”
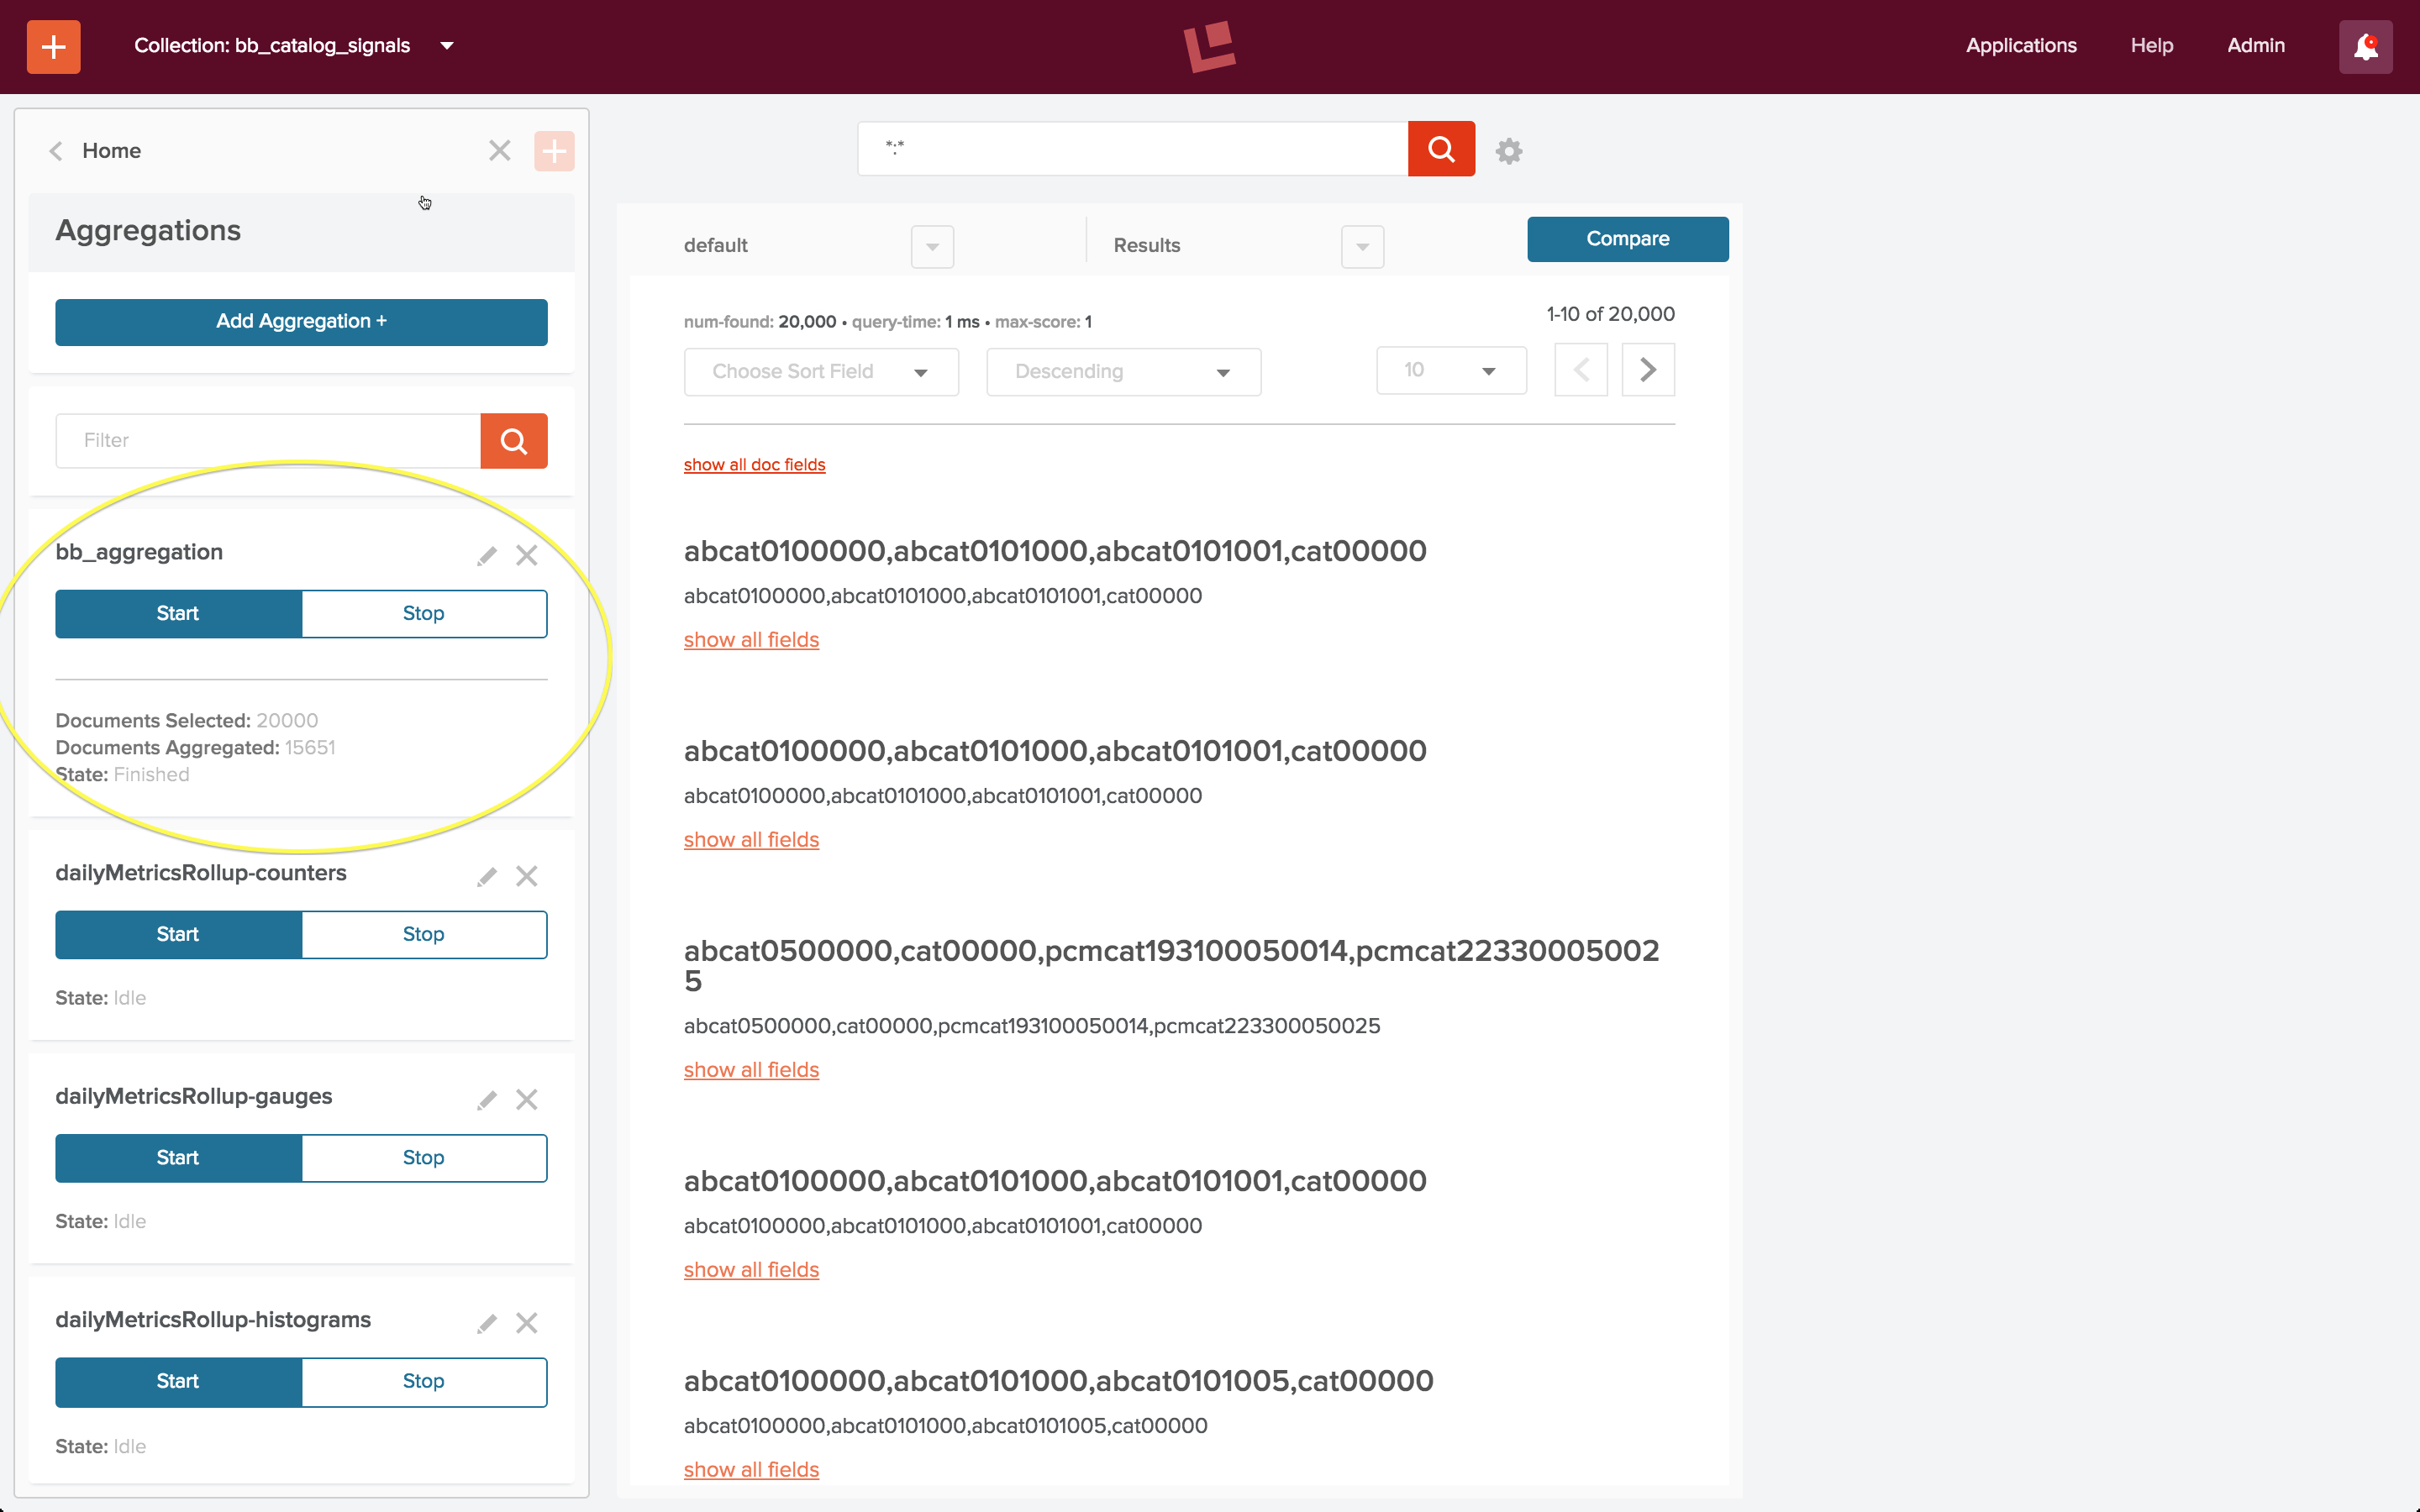
The following screenshot shows the configured aggregation. The circled fields are the fields which I specified explicitly; all other fields were left at their default values.
Once configured, the aggregation is run via controls on the aggregations panel. This aggregation only takes a few seconds to run. When it has finished, the number of raw signals processed and aggregated signals created are displayed below the Start/Stop controls. This screenshot shows that the 20,000 raw signals have been synthesized into 15,651 aggregated signals.
To check my work, I use the Fusion 2 UI to view the aggregated signals collection, by explicitly specifying the URL “localhost:8764/panels/bb_catalog_signals_aggr”. Aggregated click signals have a “count” field which reflects the number of times the combination search query + document id occur. (Note: my original post stated incorrectly that this ordering shows most popular queries – it doesn’t – this count is over query + action, which is a more complex and more useful piece of information.) The following screenshot shows this sort ordering:
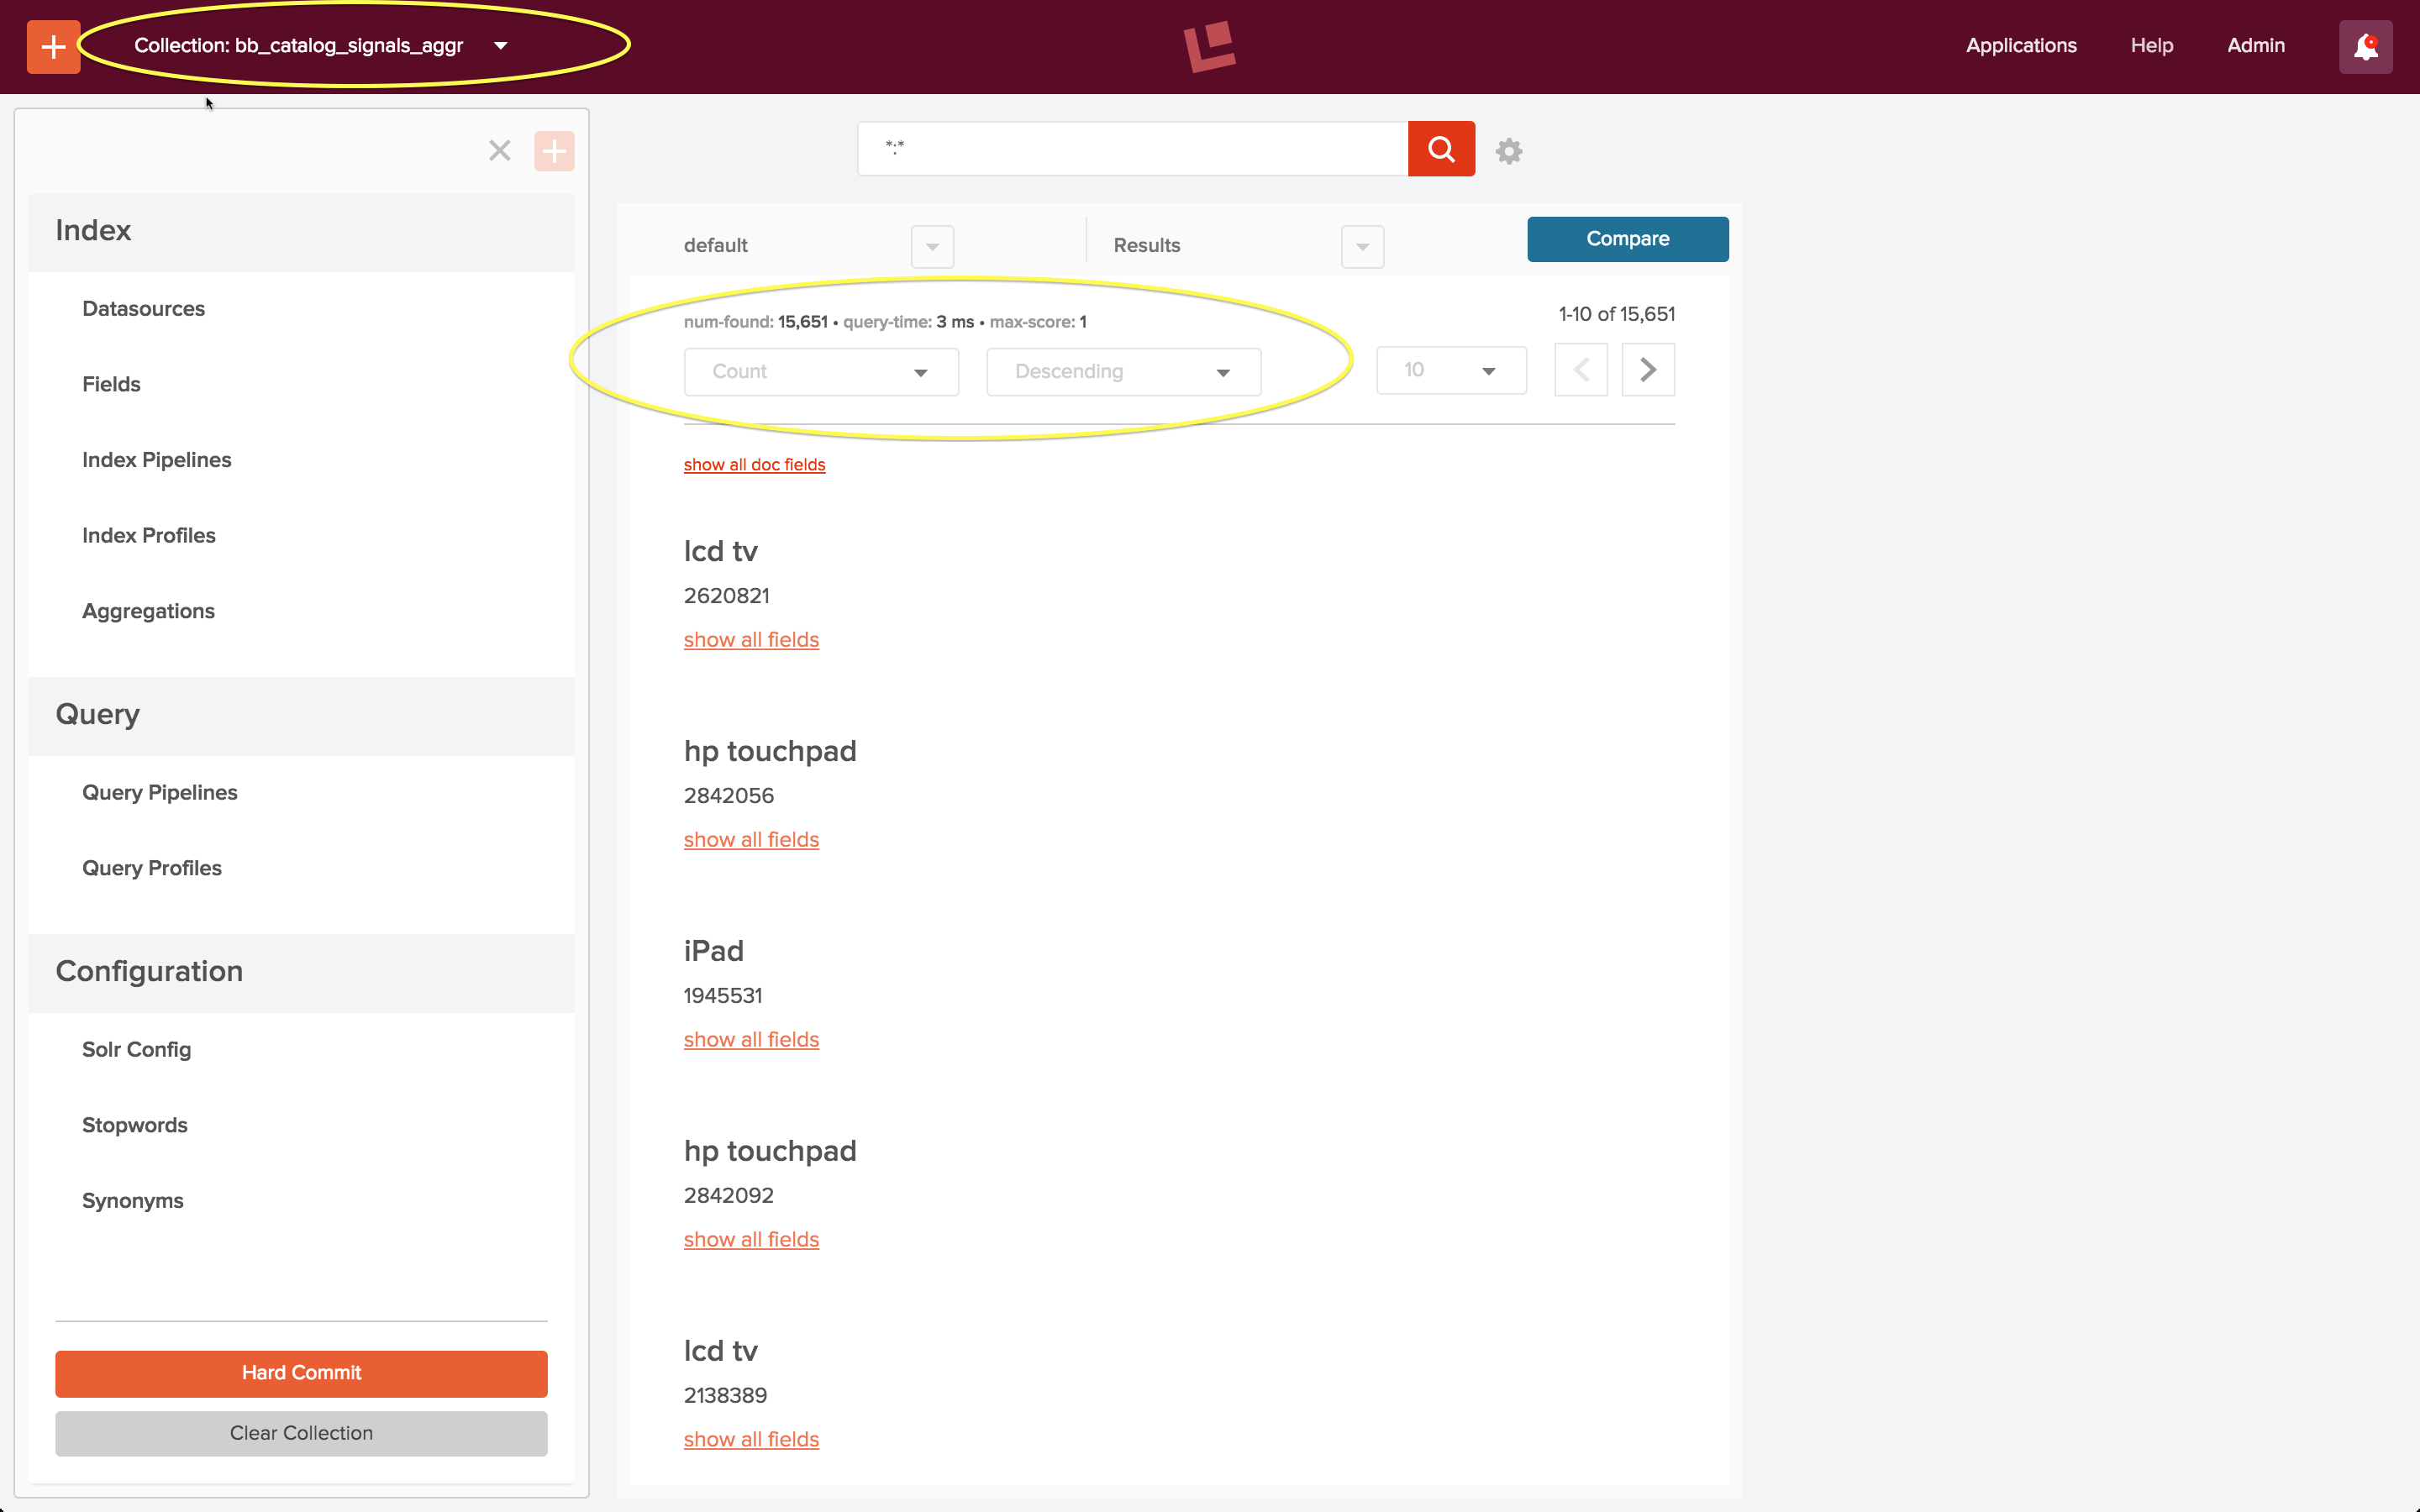
The searches over the Best Buy catalog which show strong patterns of user behavior are searches for major electronic consumer goods: TVs and computers, at least according to this particular dataset.
Fusion REST-API Recommendations Service
The final part of the example signals script “signals.sh” calls the Fusion REST-API’s Recommendation service endpoints “itemsForQuery”, “queriesForItem”, and “itemsForItems”. The first endpoint, “itemsForQuery” returns the list of items that were clicked on for a query phrase. In the “signals.sh” example, the query string is “laptop”. When I do a search on query string “laptop” over collection “bb_catalog”, using the default search pipeline, the results don’t actually include any laptops:
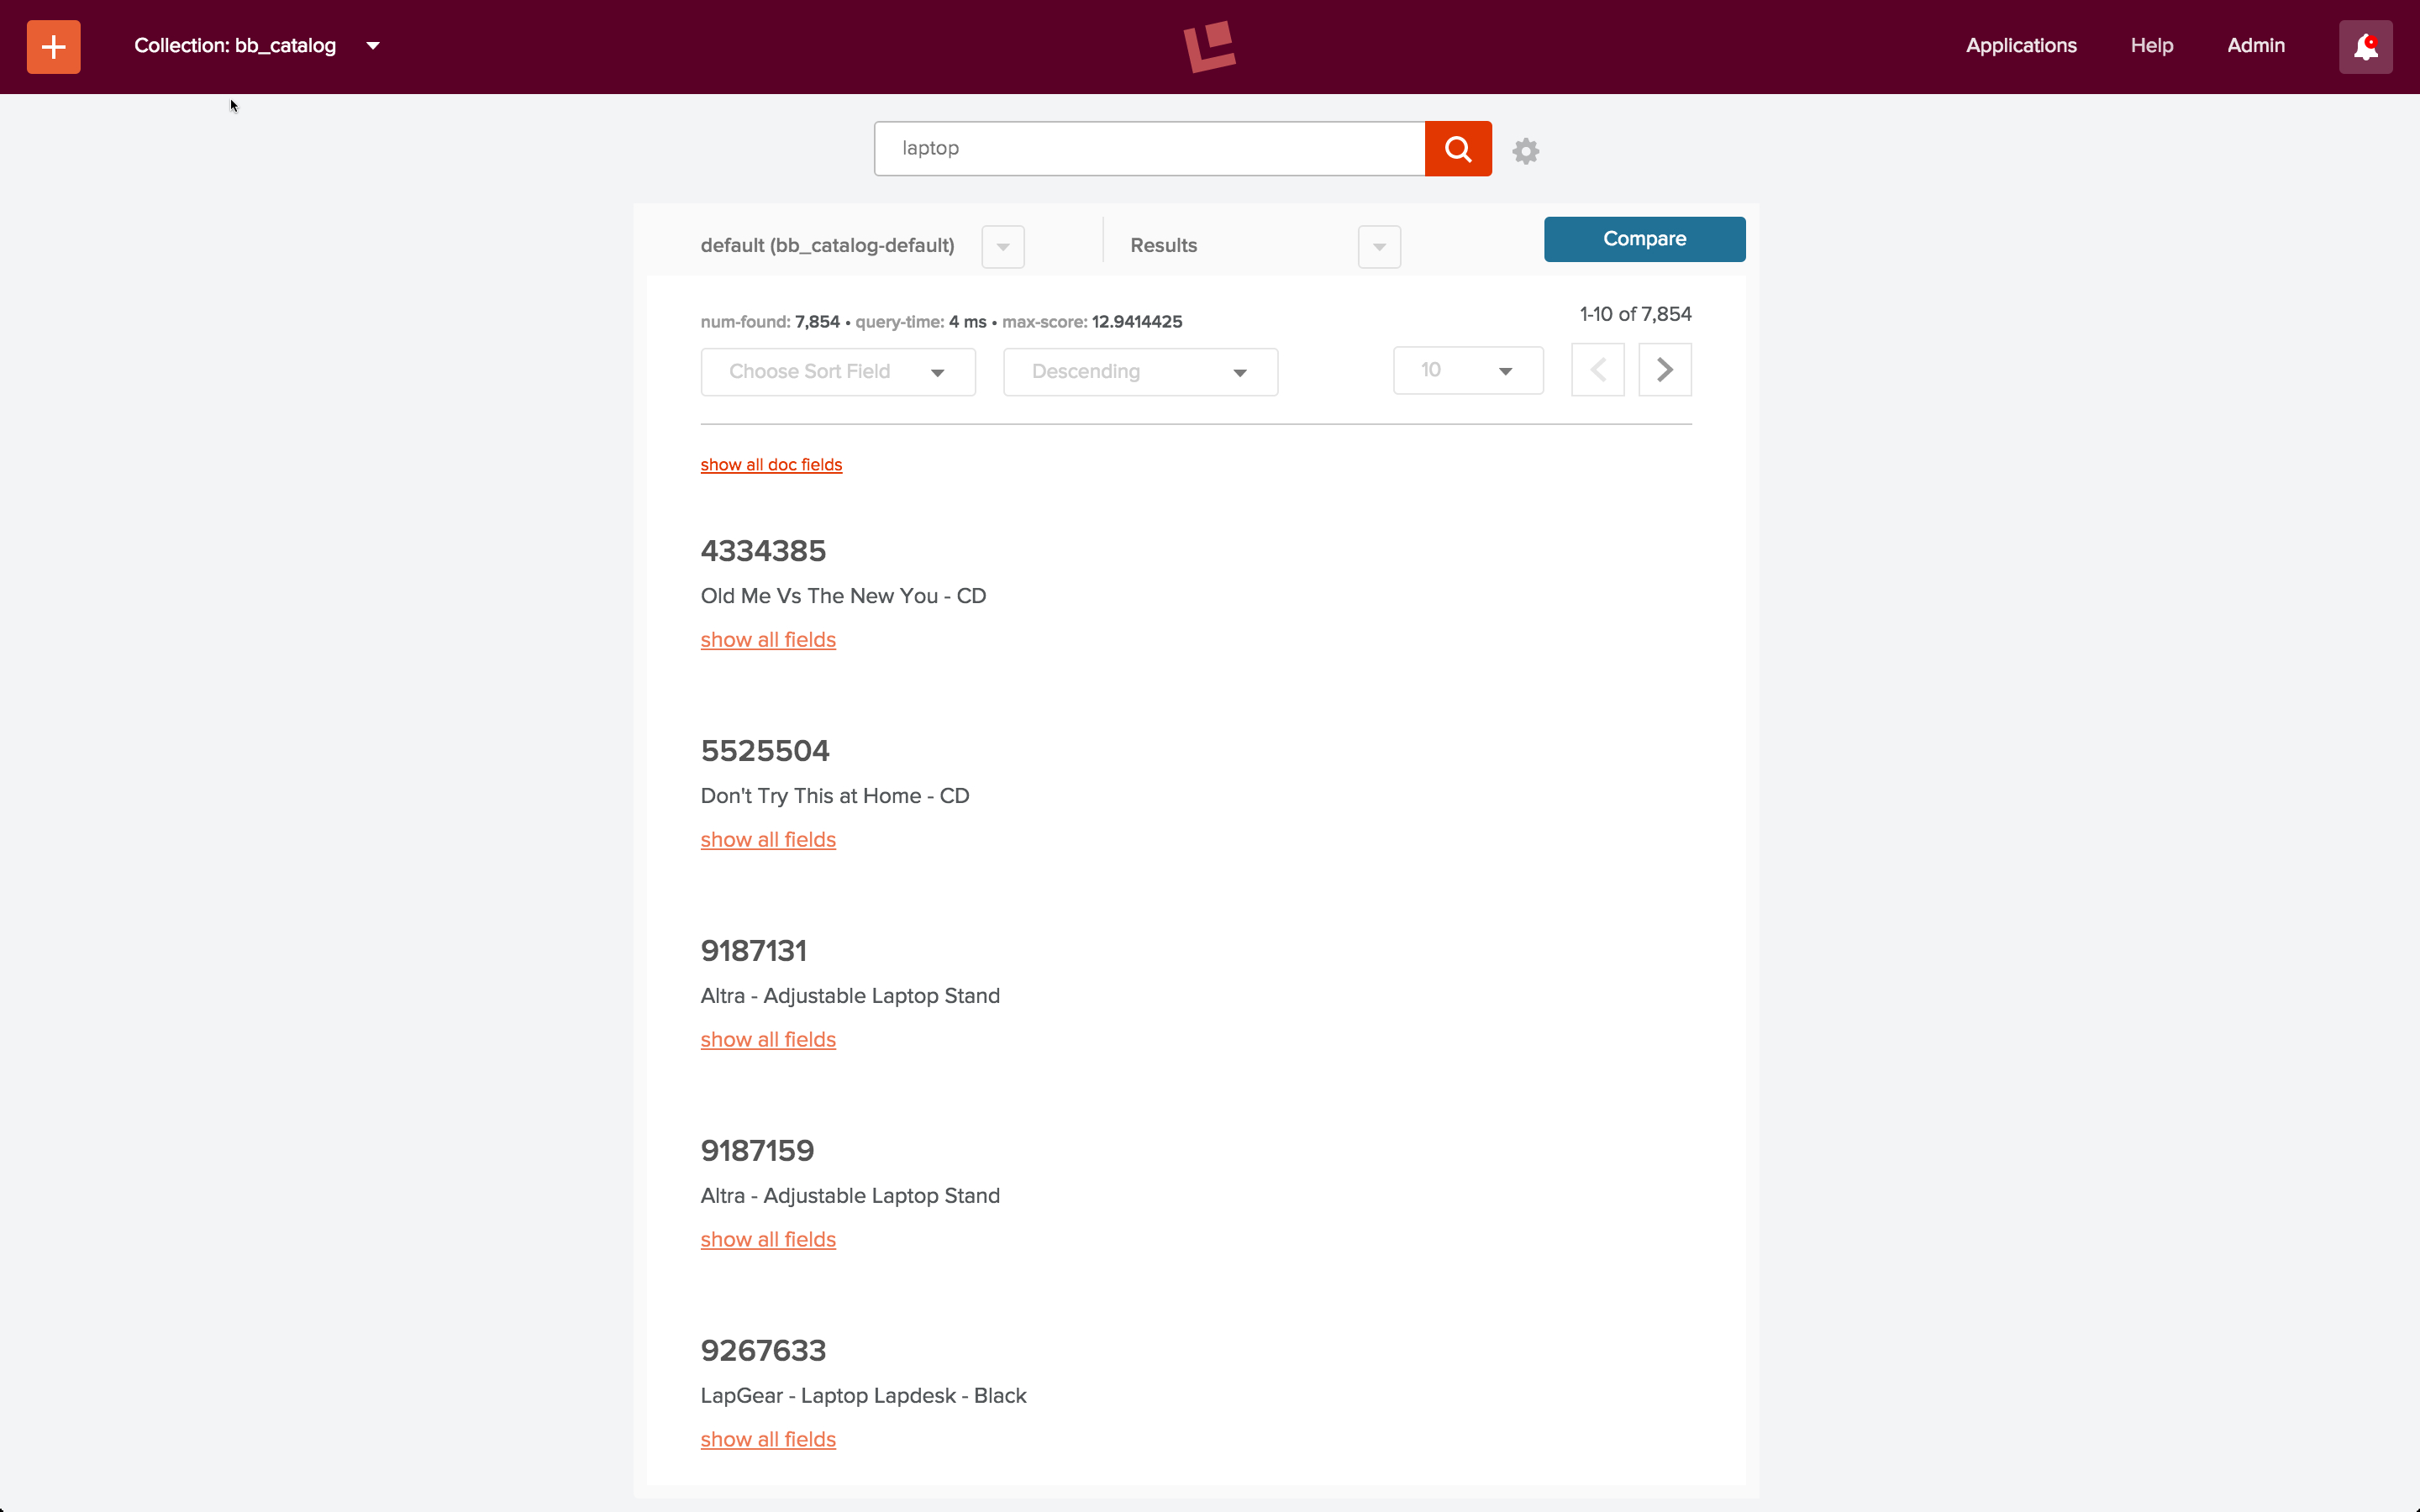
With properly specified fields, filters, and boosts, the results could probably be improved.
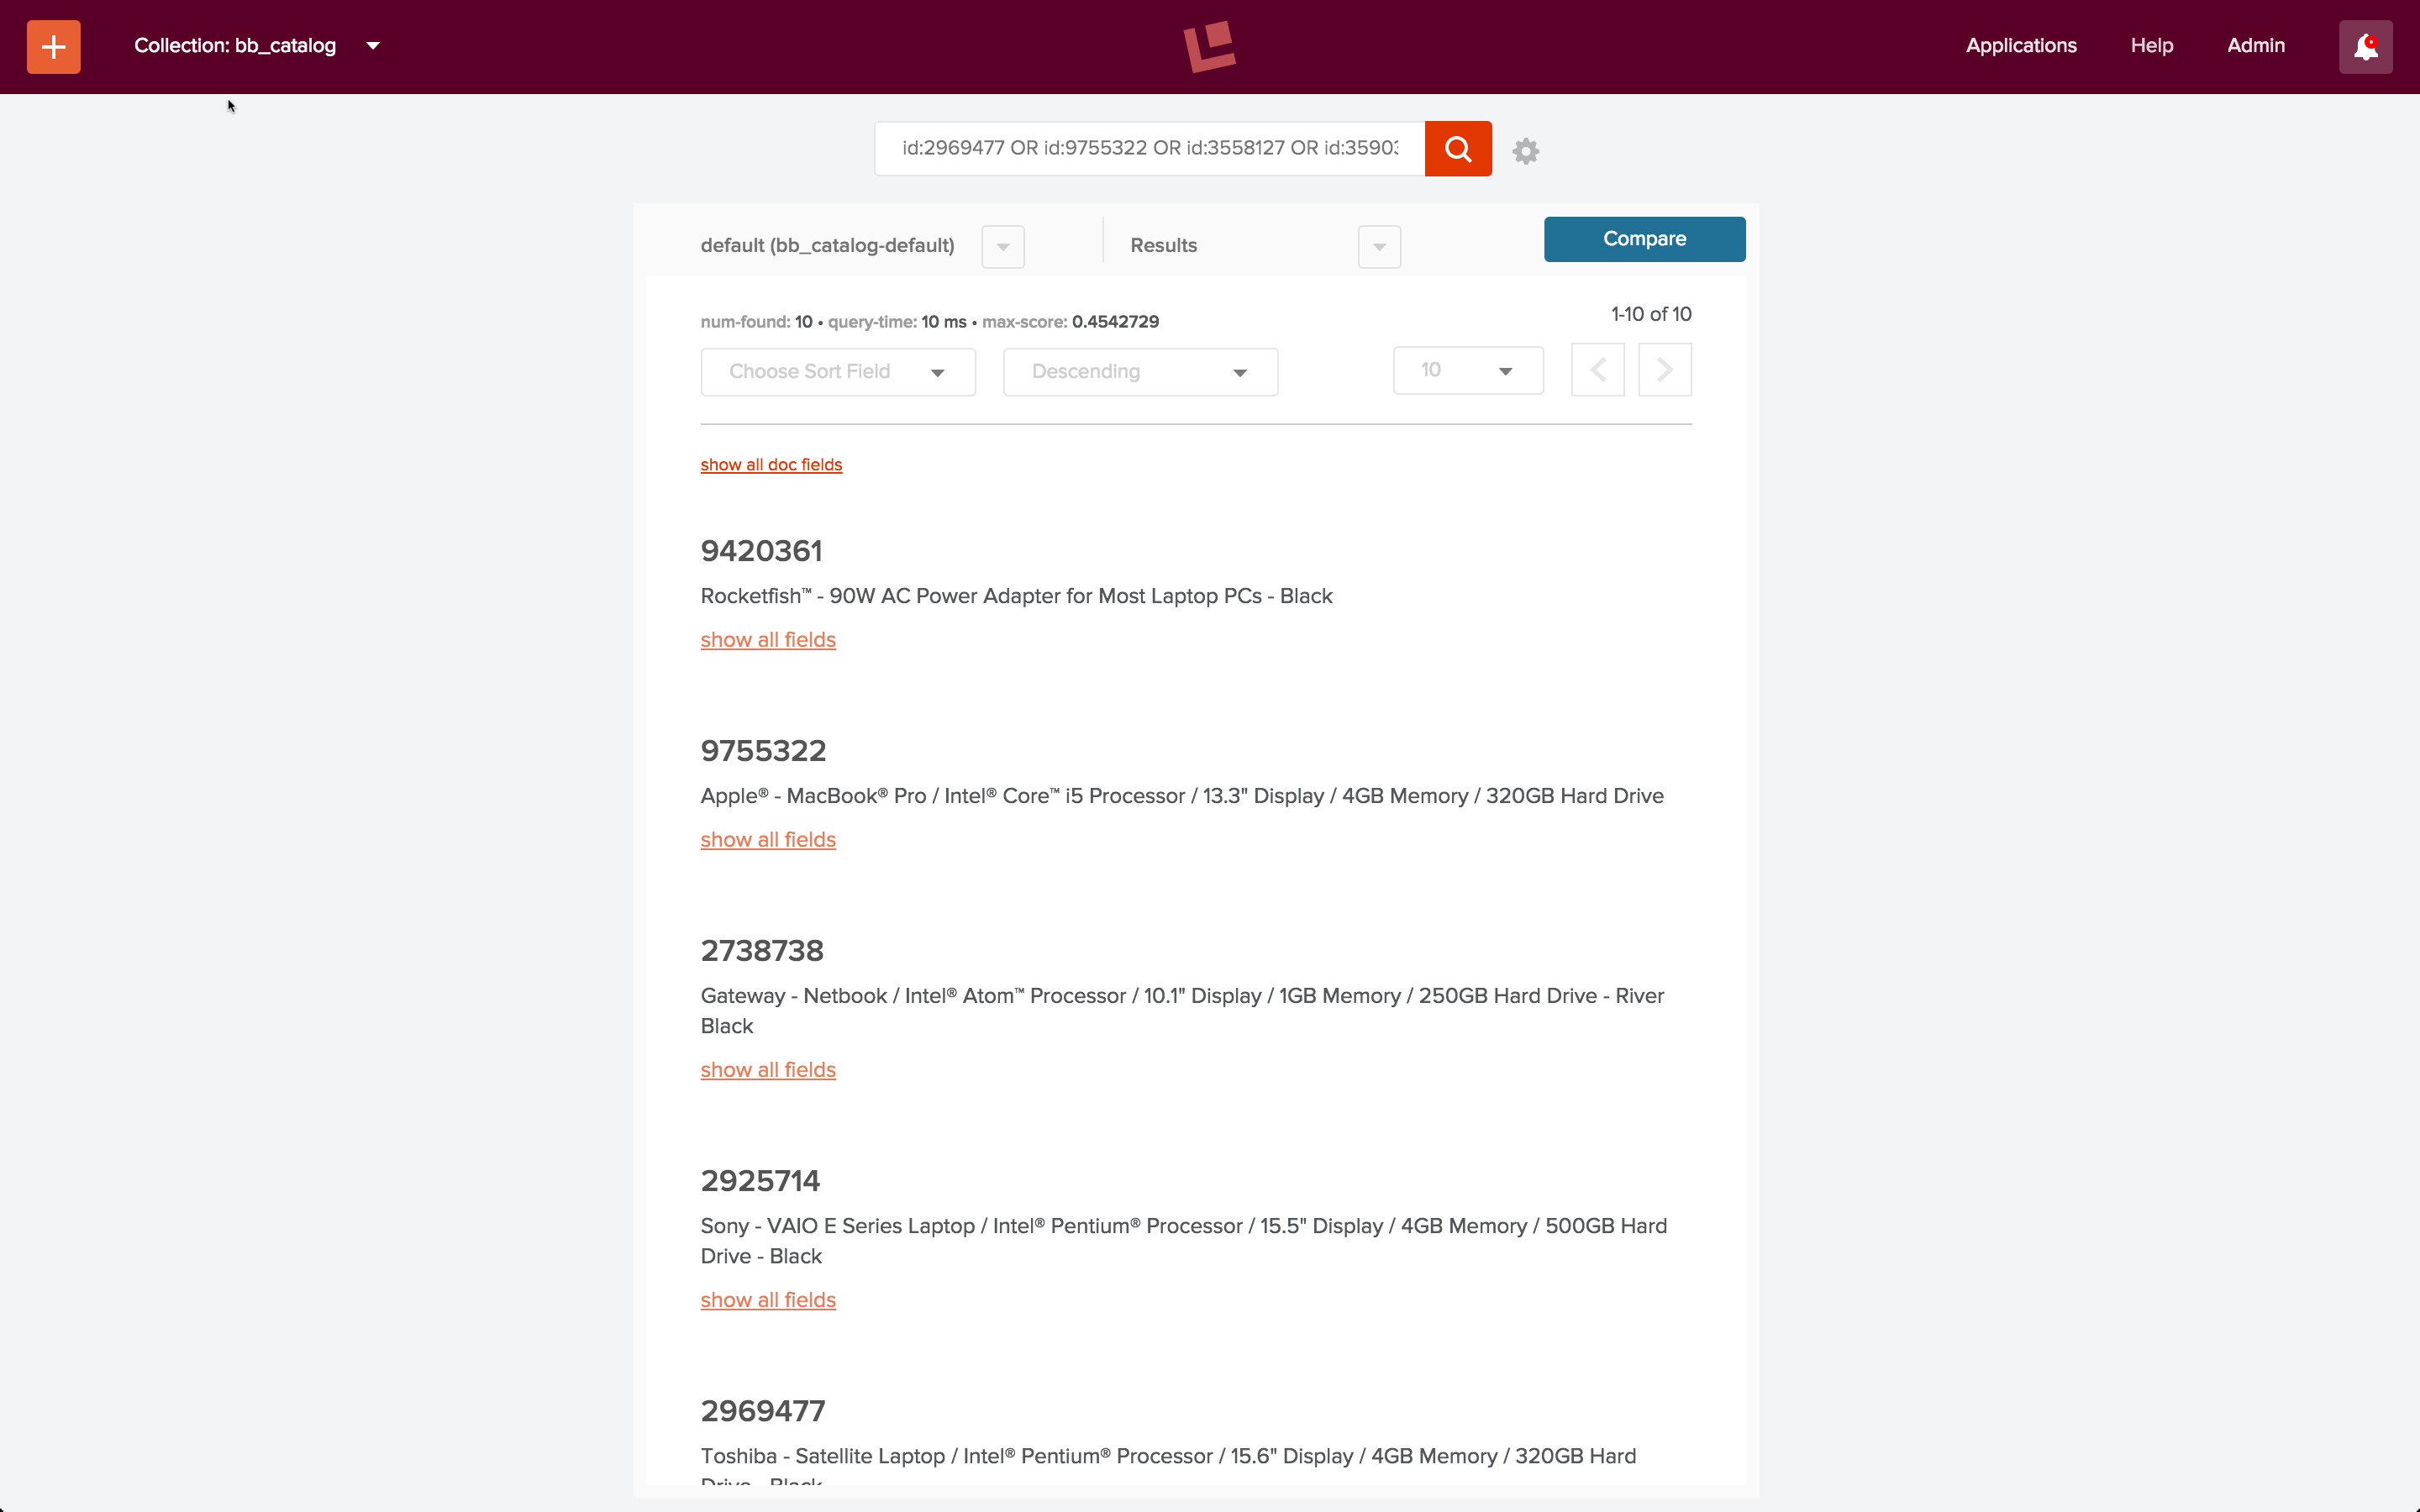
With aggregated signals, we see improvements right away. I can get recommendations using the “itemsForQuery” endpoint via a curl command:
curl -u admin:password123 http://localhost:8764/api/apollo/recommend/bb_catalog/itemsForQuery?q=laptop
This returns the following list of ids: [ 2969477, 9755322, 3558127, 3590335, 9420361, 2925714, 1853531, 3179912, 2738738, 3047444 ], most of which are popular laptops:
When not to use signals
If the textual content of the documents in your collection provides enough information such that for a given query, the documents returned are the most relevant documents available, then you don’t need Fusion signals. (If it ain’t broke, don’t fix it.) If the only information about your documents is the documents themselves, you can’t use signals. (Don’t use a hammer when you don’t have any nails.)
Conclusion
Fusion provides the tools to create, manage, and maintain signals and aggregations. It’s possible to build extremely sophisticated aggregation functions, and to use aggregated signals in many different ways. It’s also possible to use signals in a simple way, as I’ve done in this post, with quick and impressive results.
In future posts in this series, we will show you:
- How to write query pipelines to harness this power for better search over your data, your way.
- How to harness the power of Apache Spark for highly scalable, near-real-time signal processing.
LEARN MORE
Contact us today to learn how Lucidworks can help your team create powerful search and discovery applications for your customers and employees.